

When it comes to economic analysis, price indices are almost everywhere. In fact, the American Institute for Economic Research publishes its own Everyday Price Index. Keeping track of each one would be a full-time job in and of itself. Some, like the Consumer Price Index or the Producer Price Index, receive tremendous coverage and discussion. Others, like the Import Price Index, often go largely unreported and underappreciated.
This Explainer seeks to correct this. Once understood, the Import Price Index, with its ability to summarize the changes in the price of imported goods, is one of the most important tools of economic analysis available. It can help businesses and consumers understand what is happening in the world, how it affects their bottom line, and what steps (if any) they can take to mitigate those effects. It also helps those interested in policy understand where problems may lie and what the effects of various policies have been on the world stage.
Like all statistics, understanding how it is constructed and how to use it in conjunction with other data can provide a rich understanding of the global economy. This also helps us understand where the evidentiary reach of the Import Price Index ends. This matters for trade policy in particular, as changes in the Index are often cited as evidence that one party is paying the cost of tariffs and other duties.
This Explainer proceeds in four parts. First, it provides a brief history of the origins of the Import Price Index and the problems that its creation solved. Second, it describes what the index is — what it is not. Third, it explains what the Import Price Index can tell us about tariffs and their incidence. Finally, it considers the limits of the index and how it can be misinterpreted.
What Is the Import Price Index?
The Import Price Index (IPI) is an official monthly measure of how the prices of goods entering the United States change over time. It is produced by the Bureau of Labor Statistics (BLS) as a part of its International Price Program.
The idea of an import price index was most forcefully proposed by Irving Kravis and Robert Lipsey in their 1971 book Price Competitiveness in the World. Prior to this, economists had typically studied international trade by deriving prices based on reports of total spending and quantities imported — an indirect method that produced what are called “unit values.” By design, unit values are averages, and averages can be misleading. For example, when a child is born, the unit value of household income per person falls, but it would be foolish to treat that as a loss of income. Kravis and Lipsey found that the unit-value measures produced indices that were more volatile and systematically biased than those based on direct price measurement.
The IPI answers a simple question: “Are we paying more or less than we used to for the things that we buy from abroad?”
What Is and Is Not Included in the IPI?
To answer this question, the IPI measures the average change in the price level for a “representative basket” of US imports. To construct this, the BLS looks at the actual prices paid by importers in the US for the goods they import. Survey staff at the BLS collect this information directly from importers through their participant program.
What Is Included
For example, imagine a simple economy that imports steel, aluminum, and bananas. We could record the amounts purchased and prices paid in Year 1 in a table such as this:
| Good | Quantity | Price Per Ton | Total Spent |
| Steel | 1.5 million tons | $1,000 | $1.5 billion |
| Aluminum | 2 million tons | $3,000 | $6 billion |
| Bananas | 4 million tons | $1,250 | $5 billion |
All told, this simple economy imported $12.5 billion worth of imports.
The following year (Year 2), suppose that the import data is this:
| Good | Quantity | Price Per Ton | Total Spent |
| Steel | 1.8 million tons | $1,200 | $2.16 billion |
| Aluminum | 2.1 million tons | $2,800 | $5.88 billion |
| Bananas | 3.5 million tons | $1,500 | $5.25 billion |
This time, the economy imported $13.29 billion worth of goods. But what happened to import prices overall? The price of steel and bananas increased, while aluminum became cheaper. The quantities also changed.
To isolate what is happening to import prices, we need to compare the cost of the same basket of goods over time. That requires establishing a representative basket of these goods. For simplicity, let’s use Year 1’s quantities. The key question, then, is: how much would Year 1’s basket cost at Year 2’s prices? The answer: $13.4 billion.
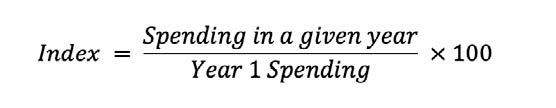
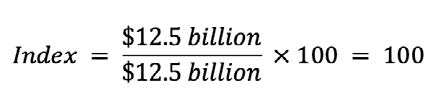
With this, we can construct an index. Year 1 serves as the base year — the year to which all others are compared. The index for Year 1 is calculated as follows:
Since Year 1 is the base year, this works out to be:
For Year 2, it would be:
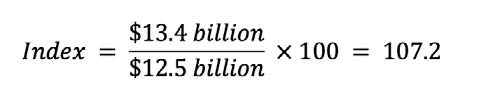
From this, we can say the price of the representative basket of imported goods increased by 7.2 percent from Year 1 to Year 2.
This example is obviously contrived and simplified. For starters, economies do not import just steel, aluminum, and bananas but tens of thousands of goods. They also import goods from many countries under different conditions, and for a variety of purposes. Some, like bananas, are imported for final consumption by consumers. Others, like steel and aluminum, are used in domestic manufacturing. The BLS tracks all of this.
Within their monthly figures, they also break imports down by type of good, country of origin, and stage of processing — that is, whether a good is a raw material, an intermediate good, or a final good. This degree of granularity gives the IPI significant strength. If we want to know how the price of, say, household appliances imported from China has changed over time, we can find the answer.
To do all of this, the BLS collects data by surveying thousands of companies, asking them to voluntarily report the actual price of a specific item they imported that month. To construct an accurate index, the goods in question must be fixed across multiple dimensions. In an ideal world, the goods would have identical specifications, come from the same trading partner, and be shipped the same way over time.
Unfortunately for the BLS, almost none of this holds in a world that is constantly innovating. Products evolve, sometimes in fits and spurts and other times by leaps and bounds. Consider the iPhone over just the past ten years. Phones have gotten thinner, more powerful, and, since 2022, no longer include a charger in the box. This latter change means that not only has the product changed, but it’s also shipped differently than before, owing to smaller boxes that allow for more iPhones to be packed in a shipping container.
The BLS tracks all of this, too, adjusting prices as necessary to reflect changes in quality. To do this, it must decide how much of a price change reflects an actual price movement and how much reflects buyers receiving a different product than before. These decisions matter greatly — different choices can produce meaningfully different measurements of price changes.
What Is Not Included
The Import Price Index covers changes in the price of imported goods, but not imported services. But even saying that it covers only goods requires further clarification. For example, any costs incurred after the goods arrive at the port are not included in the IPI. These would include costs associated with warehousing, distribution, wholesaling, and any retail markups. The IPI only considers the price the importers pay at the water’s edge. All other costs for the imported goods come later.
This matters for trade policy because, as the BLS notes, “the prices for the items used to calculate the Import/Export Price Indexes exclude duties.” In this context, duties are taxes or tariffs placed on imported goods. This makes sense because the legal incidence — who actually pays the US Treasury — falls on Americans. As a result, import duties are applied after goods arrive at the port.
Additionally, because the IPI is measured in US dollars, exchange rate movements are automatically baked into the index. When the dollar strengthens, American buyers will pay fewer dollars for foreign goods even if prices abroad do not change. Conversely, when the dollar weakens, import prices in dollars tend to rise. This matters because when there is significant exchange rate movement, the currency effect on the IPI can be large enough to impact the index. Anyone using the IPI to make claims about trade policy must account for exchange rate movements.
Who Pays the Tariff?
At its core, a tariff is a tax on the importation of goods. When the US imposes a tariff on, for example, steel, that tax raises the cost of bringing steel into the domestic market. Like any tax, there is a distinction between the legal incidence (who writes the check) and the economic incidence (who bears the cost). The question of who bears the economic incidence of a tariff is of genuine interest to policymakers when assessing the impacts of trade policy.
In practice, there are three parties that can absorb a tariff, and any combination of them can bear some of the total burden:
- The foreign exporter can absorb the tariff. In this case, the exporter lowers its pre-tariff price and sells the goods to the US market at a discount. After the tariff is applied, the final price paid by the importer remains roughly unchanged, inclusive of the tariff.
- The importer or domestic business can absorb the tariff. Should this happen, the foreign exporter keeps prices steady, and the American importer pays the tariff on top of that price. The cost is then absorbed somewhere in a supply chain, such as reduced profits for domestic manufacturers, wholesalers, or retailers.
- The US consumer can absorb the tariff. Under this scenario, the cost of the tariff is passed through to the end consumer in the form of higher retail prices.
Using the IPI to study the incidence of the tariff is relatively straightforward. If foreign exporters lower their dollar prices in response to US tariffs, we would see the IPI fall in the affected product categories after the tariff takes effect.
If, however, foreign exporters keep their prices the same, the IPI would remain relatively flat, or even rise. This would indicate that the full cost of the tariff is being paid by the US importers, who must then decide how much of the added cost to pass on to domestic manufacturers and consumers.
Researchers have used this exact logic, especially in the last ten years, to analyze the effects of the Trump tariffs imposed in 2018 and 2019, and are now doing so for tariffs in 2025. The results have been fairly consistent: once exchange rate movements are taken into account, foreign exporters largely kept their prices steady.
This is an important finding in its own right. It indicates that, rather than foreign entities paying these tariffs, Americans faced nearly the full burden — either through reduced profitability in downstream industries due to higher material costs or higher prices paid by households.
What the IPI Cannot Tell Us
For all its usefulness, the IPI alone cannot tell us everything we might want to know about the effects of trade policy.
Because it measures prices at the water’s edge, it does not tell us what happens to prices at the cash register. Tracing the full pass-through from import prices to consumer prices requires combining the IPI with the Producer Price Index and the Consumer Price Index. It also requires a model of how supply chains respond to these cost pressures — specifically, which costs are passed along and which are absorbed. The IPI is the beginning of this chain of analysis, not the end.
As noted earlier, the IPI also does not account for exchange rate movements, which can either amplify or obscure the effects of trade policy. During the tariff escalation of 2018 and 2019, the US dollar became significantly stronger against the Chinese yuan. This was in part due to the tariffs, which foreign countries can respond to by devaluing their own currency, but also because of Chinese state policy designed to monetize their growing debt problems. A weakened yuan will automatically lower the dollar price of US imports from China, which would show up in the IPI as falling import prices. But again, this is not evidence that China was “paying the tariffs.”
The IPI also does not capture product switching or supplier substitution. When tariffs make imports from one country more expensive, firms often adjust to avoid them. When the US imposed tariffs on South Korean washing machines in 2012, Samsung and LG simply moved production to China and continued exporting from there. Likewise, US importers shifted their purchases to Vietnam and Mexico. Tariffs on Chinese steel redirected purchases to Canada and Brazil. In these cases, the IPI remained largely unchanged because the now-tariffed products were rerouted through alternative countries not subject to tariffs. Yet the actual costs that Americans paid for these products rose, as production shifted to less efficient and more distant suppliers.
Finally, the IPI cannot measure trades that did not happen. Because tariffs impose costs, they necessarily reduce the volume of trade by preventing transactions that otherwise would have happened and made both parties better off. In the absence of these trades, domestic resources are redirected toward less efficient uses. The IPI reflects none of this, capturing only the price of goods that were actually imported. It remains silent on the economic welfare costs of goods that were not imported because the tariffs made them too costly.
Reading the Import Price Index Responsibly
The IPI is a genuinely valuable tool — well-constructed and useful when applied appropriately. It becomes even more powerful when used alongside other data, such as exchange rates and consumer and producer price indices. For economists, business analysts, central bankers, and policymakers, it can provide important insights into the effects of trade policy.
Every tool has proper uses and improper ones. A thermometer is a great tool for determining if someone is sick, and your doctor carries one for good reason. However, a thermometer alone is not a good tool for distinguishing between the flu and a common cold. Likewise, using the IPI to claim that foreign countries are “paying the tariff” is like using a thermometer reading alone to declare that someone is healthy.
Fortunately, the data needed for this kind of analysis and others like it are freely available online. The IPI, the consumer and producer price indices, and exchange rate data are all publicly available and updated regularly. Understanding what each measure captures is not just important for economists and their students taking exams. When trade policy is changing rapidly and justified with sweeping claims, an informed public that knows how to read the evidence is essential.
What the IPI is not, however, is a complete answer to the question of who bears the cost of tariffs. It tells us what happens at the water’s edge, not on the factory floor, not at the warehouse, and not at the cash register. It cannot capture the effects of currency movements or supply chain shifts, nor can it tell us anything about trades that did not happen.


0 Comments