The Institute for Supply Management’s composite services index increased to 56.7 percent in July, rising 1.4 points from 55.3 percent in the prior month. The index remains above neutral and suggests the 26th consecutive month of expansion for the services sector (see top of first chart). However, many of the participant’s comments were cautious as price and labor pressures continue and signs of weakening demand start to accumulate.
Among the key components of the services composite index, the business activity index gained 3.8 points to 59.9 (see top of first chart). That is the 26th month above 50. Thirteen industries reported increased activity while four reported slower activity.
The services new-orders index rose to 59.9 percent from 55.6 percent in June, an increase of 4.3 percentage points. July was the best result since March (see bottom of first chart). The new orders index has been above 50 percent for 26 consecutive months.
The nonmanufacturing new-export-orders index, a separate index that measures only orders for export, also improved in July, coming in at 59.5 versus 57.5 percent in June. Six industries reported growth in export orders, matching the six reporting declines and six reporting no change. However, for all respondents, only about 21 percent said they perform and track separate activity outside the US.
Backlogs of orders in the services sector likely grew again in July though the pace likely decelerated as the index decreased to 58.3 percent from 60.5 percent. July was the 19th month in a row with rising backlogs. Nine industries reported higher backlogs in July, while five reported decreases.
The services employment index improved in July but remained below the neutral 50 level, coming in at 49.1 percent, up from 47.4 percent in June. That is the fourth time in the last six months that the employment index was below neutral (see bottom of first chart). The weak reading reflects lack of supply rather than lack of demand.
Eight industries reported growth in employment while seven reported a reduction. Respondents suggest qualified labor continues to be is in short supply and competition remains intense.
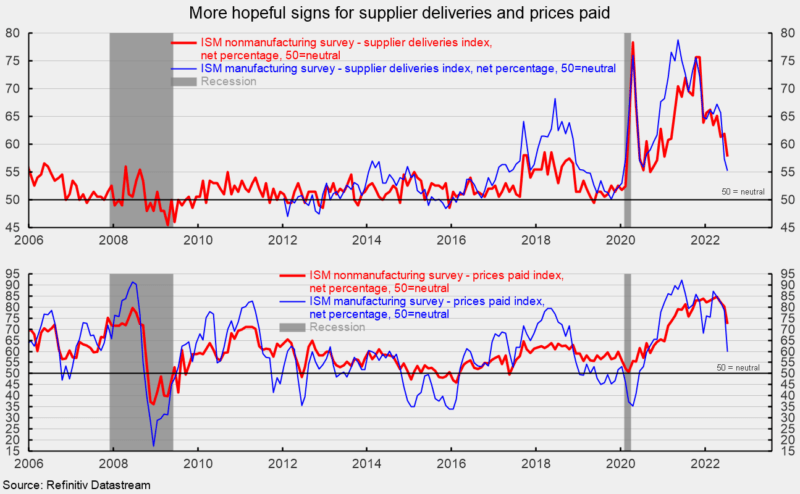
Supplier deliveries, a measure of delivery times for suppliers to nonmanufacturers, came in at 57.8 percent, down from 61.9 percent in the prior month (see top of second chart). It suggests suppliers are falling further behind in delivering supplies to services business, but the slippage has decelerated from the prior month. The index has moved sharply lower since back-to-back readings above 75 in October and November 2021 and is at the lowest level since January 2021. The manufacturing sector survey matches the recent improvement (see top of second chart). For the services sector, fourteen industries reported slower deliveries in July while none reported faster deliveries.
The nonmanufacturing prices paid index fell to 72.3 in July, the third consecutive decline from a record-high 84.6 percent in April (see bottom of second chart). Sixteen industries reported paying higher prices for inputs in July. Price pressures have eased somewhat for both the services and manufacturing sectors but remain intense (see bottom of second chart). The latest the Institute of Supply Management report suggests that the services sector and the broader economy expanded for the 26th consecutive month in July. Respondents to the survey continue to highlight ongoing input price pressures, as well as materials and labor shortages. Respondents also noted some signs of easing demand and concern about the economic outlook.


0 Comments