

Two previous pieces in this series argued that the Consumer Price Index (CPI) leaves out major costs that American consumers actually pay. First, the fiscal cost of government spending is obscured because taxpayers do not choose voluntarily to buy national defense or a regulatory agency the way they choose groceries. And second, the CPI leaves out the price of stocks, homes, and other assets, because the index is built for “pure consumers” who spend the whole of their income on present consumption, holding no portfolio and building no wealth for the future. This third and final piece asks what happens to measured real wages when we include those missing numbers.
Both methodological exclusions are theoretically defensible, but both leave out a large and growing share of what shapes Americans’ actual financial positions. Are households’ paychecks actually buying more over time, when those very relevant factors are included?
Building a Broader Measure of Inflation
Both blind spots can be folded back into a broader inflation measure, which should bring us closer to the real economic experience of American households.
Combining the CPI, federal tax receipts, and two asset-price series into one index requires a weighting scheme, and just like for the subindices of the CPI, there are no objectively correct weights. For this measure, CPI inflation is weighted at 70 percent and the growth of tax receipts is weighted at 30 percent (matching the OECD’s estimate of the average tax burden on a representative US household). That takes care of exclusion number one, but still ignores assets.
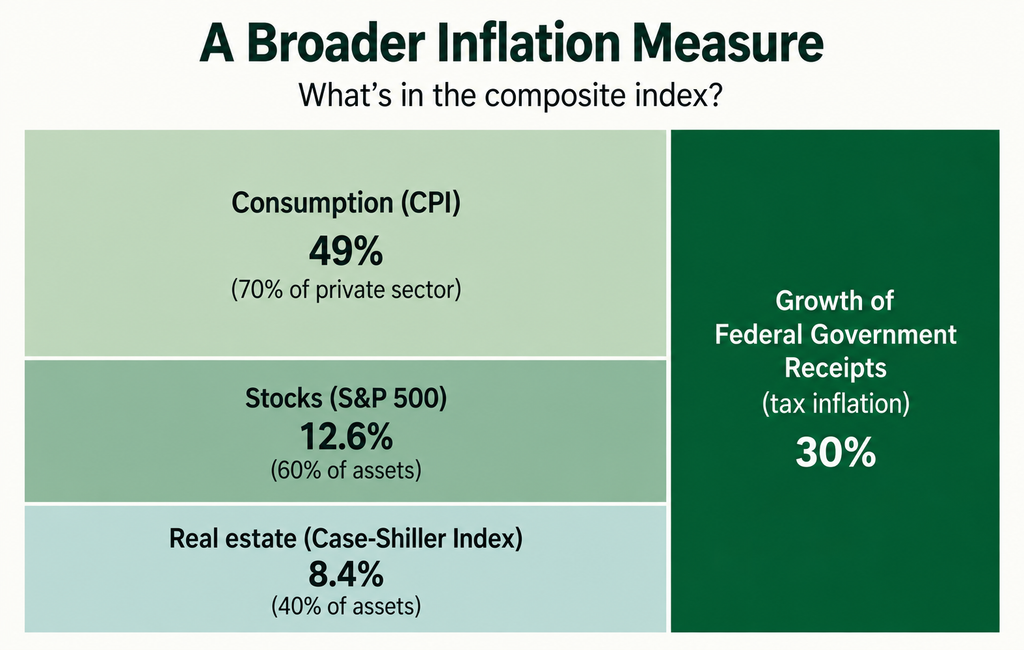
To fold in exclusion number two, the CPI weight of 70 percent is split into 70 percent of genuine private consumption (CPI) and 30 percent assets. Mirroring the Fed’s own data on American household investment accounts, assign 18 percent of CPI (60 percent of assets) to stocks (S&P 500) and 12 percent (40 percent of assets) to real estate (Case-Shiller Index).
The weights are informed by some empirical observations, but their ultimate choice remains discretionary. The double 70/30 split described above leaves us with a 49 percent weight for the CPI, 12.6 percent for the S&P 500, 8.4 percent for the Case-Shiller House Price Index, and 30 percent for federal tax receipts. Because these weights are judgment calls rather than objective measurements, the chart below also plots a conservative and an expansive variant around the same baseline.
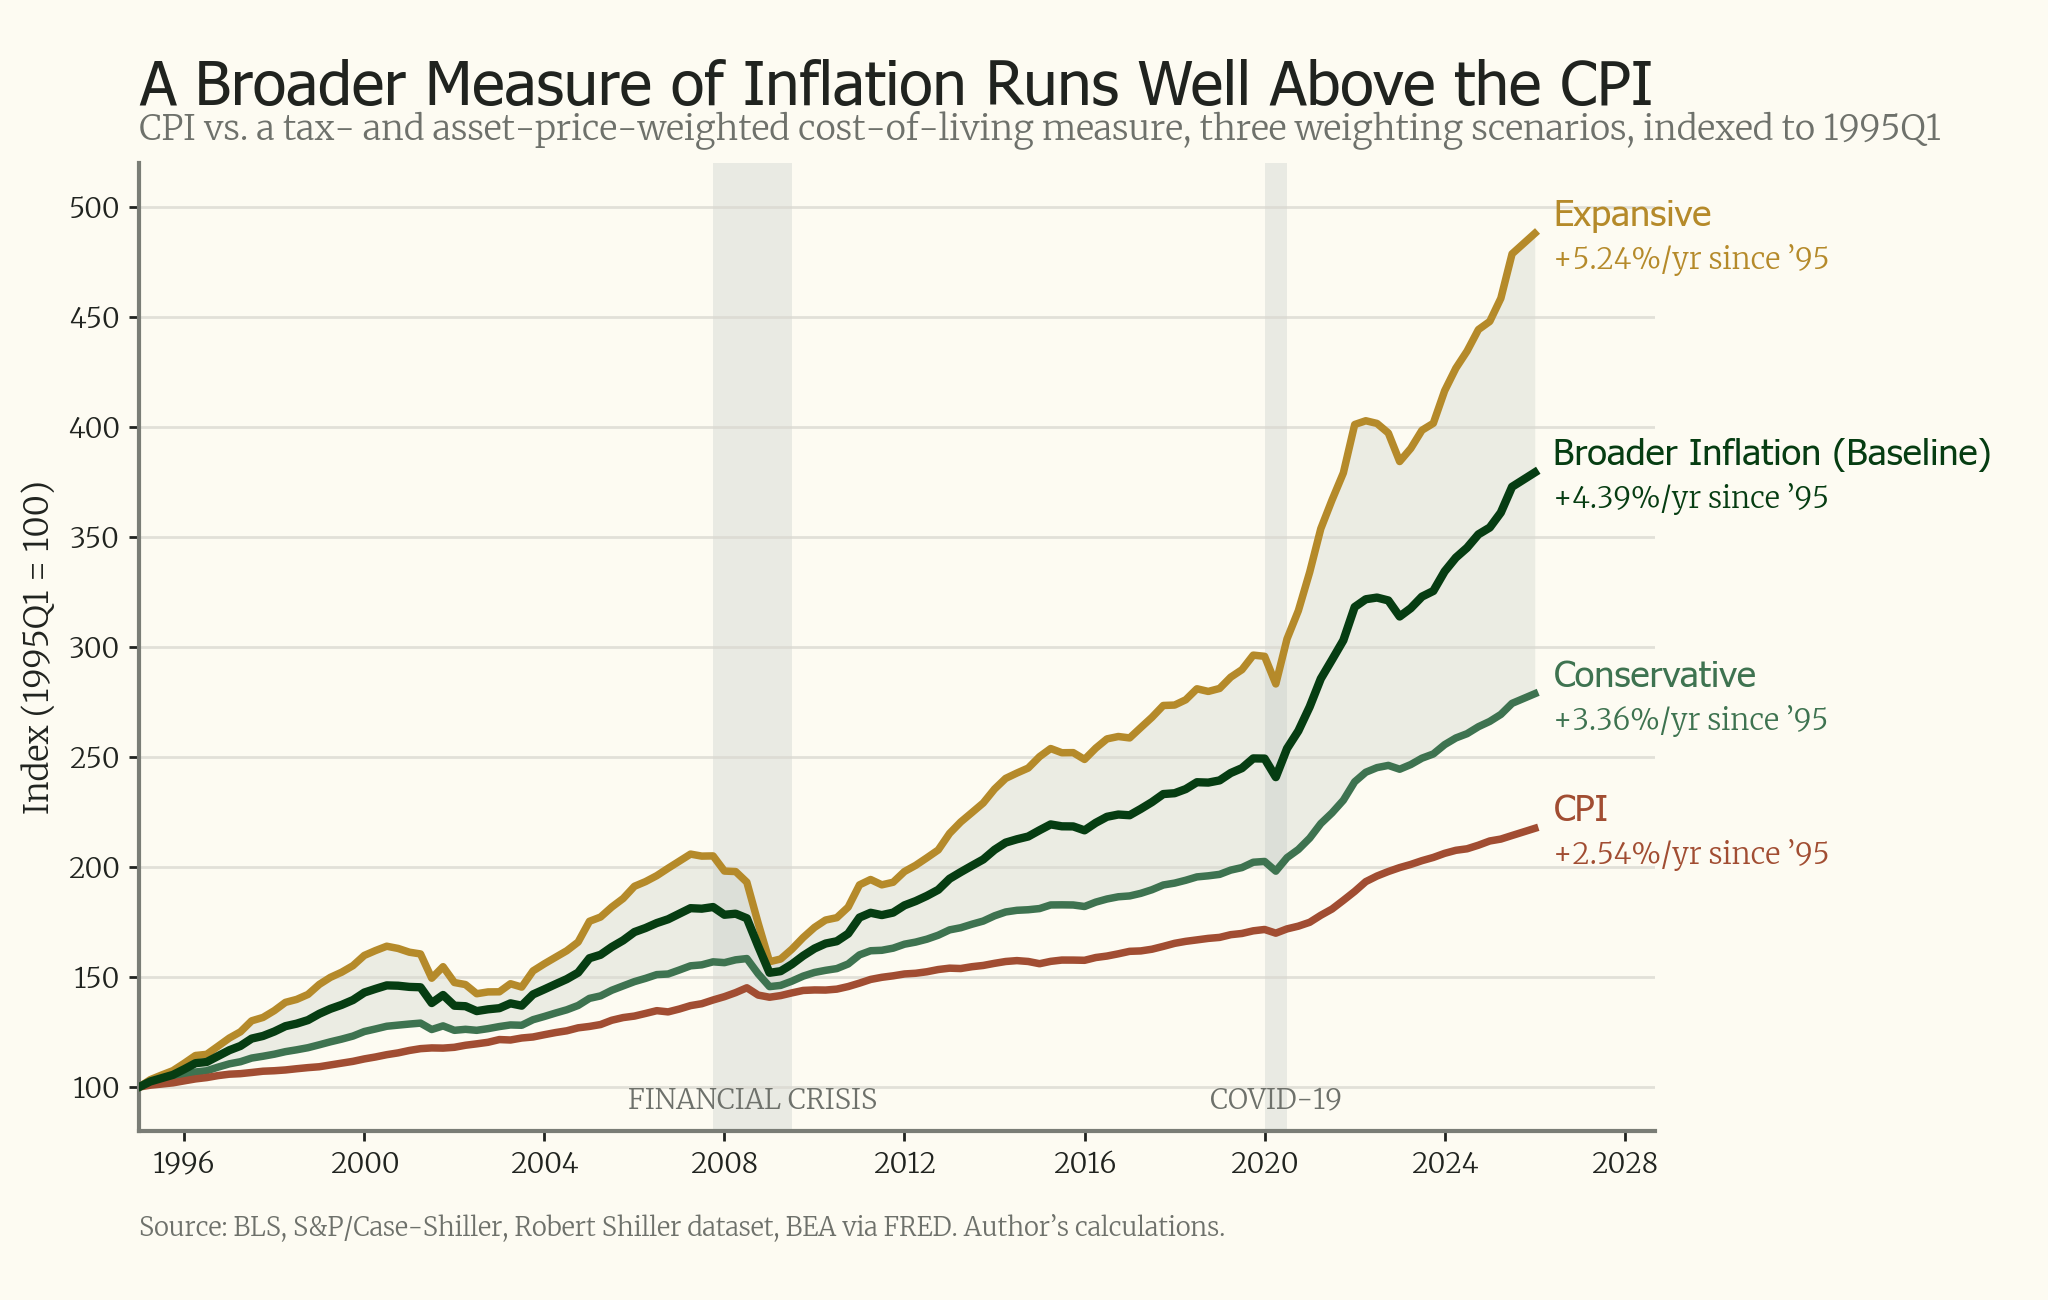
Since 1995, the CPI has grown at 2.54 percent a year. Even the conservative version of the broader measure runs distinctly hotter, at 3.36 percent. The baseline measure grows at 4.39 percent, and the expansive version at 5.24 percent — more than double the CPI’s pace. The corridor between the conservative and expansive scenarios sits above the CPI for the entire period from 1995 onward, narrowing only briefly around the dot-com crash and the 2008 financial crisis, and widening sharply again after both 2008 and 2020. The exact weights are debatable. The direction and rough magnitude of the gap are not.
What This Means for Real Wages
An inflation index is not just a number. As the denominator dividing wages, it becomes the yardstick for whether workers are actually getting ahead — or not. Median usual gross weekly earnings for full-time workers have grown at 3.14 percent a year since 1995, a cumulative increase of 161 percent — an unambiguously large nominal gain. What that gain is worth depends entirely on what it is measured against.
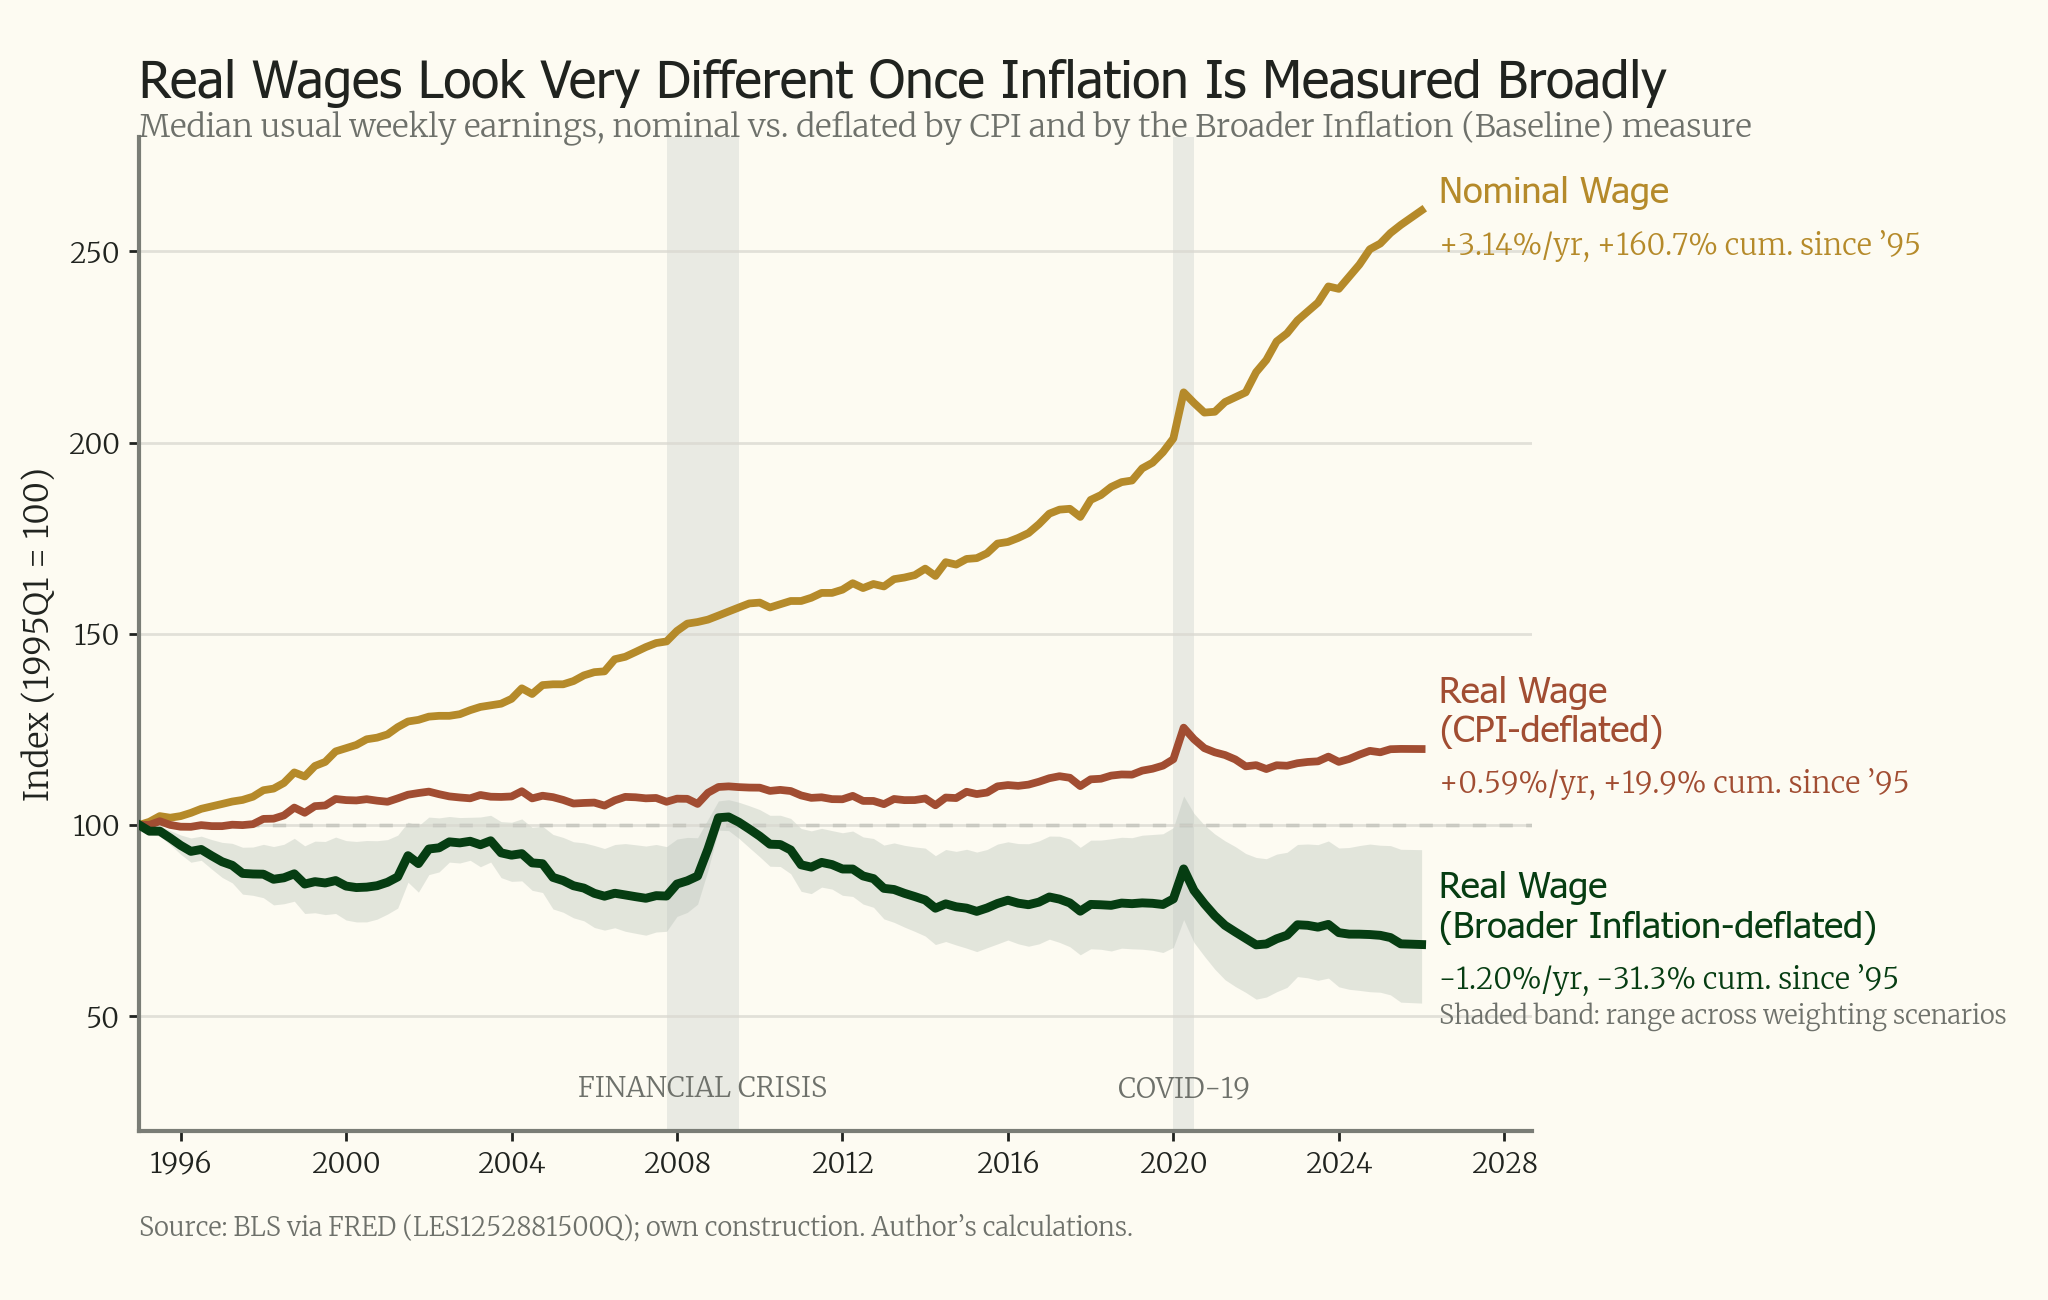
Deflated by the BLS-reported CPI, real weekly earnings have grown at 0.59 percent a year since 1995 – a cumulative gain of about 20 percent in three decades. Modest, but a gain. That is the standard, official account of how American workers have fared: real wages essentially flat to modestly improving.
Deflated by the baseline broader measure instead, real weekly earnings have fallen at 1.20 percent a year, a cumulative loss of 31 percent.
Even under the conservative weighting, real wages are down six percent since 1995; under the expansive weighting, they are down 47 percent.
Comparing the broader measure to the official CPI, these are not small revisions to the same basic story. They are two different stories. One, which the government reports and the media repeats, says the typical worker’s purchasing power has been roughly stable for three decades, or slightly increased. The other, which includes taxes and asset prices Americans actually pay, says it has fallen by somewhere between a twentieth and nearly a half. The moderate baseline indicates household purchasing power has declined by about a third in the past 30 years.
Who Pays The Price
Not every household experiences this gap the same way, and it is worth being precise about why. The broader measure proposed here treats asset-price inflation as a straightforward cost, on the theory that stocks and homes are things people eventually need to buy. But a household that already owns a diversified portfolio and a home does not experience rising stock and home prices as a cost at all — it experiences them as a capital gain, one that shows up nowhere in a wage statistic but does show up on that household’s balance sheet. For asset-owning households, the official CPI story may actually be closer to the truth, or even an understatement of how well they are doing once portfolio appreciation is counted.
The broader measure is most relevant, and most sobering, for households on the other side of that divide: people whose income is overwhelmingly labor income, who hold little or nothing in the way of financial or real assets, and who are trying to build that wealth from scratch. This describes younger workers early in their careers more than older ones, renters more than owners, and lower- and middle-income households more than upper-income households almost by definition. For this group, rising asset prices are not a gain sitting quietly in a brokerage account. They are the rising price of the down payment, the receding horizon of retirement, and the thinning of a financial cushion that household is still trying to accumulate. For them, inflation is a cost with no offsetting capital gain to soften it, while deflating exactly the wages on which they depend.
That is the throughline connecting all three pieces in this series. The CPI was never built to capture the fiscal cost of government spending or the price of assets, and there were coherent theoretical reasons for both omissions. But coherent theory does not make the omissions costless.
Once both blind spots are added back in, the story of the last 30 years of US wages looks considerably less reassuring —and it looks worst for the households least able to absorb it.





0 Comments