
AIER’s Leading Indicator fell to 41 in March 2023 from 58 in February, ending a two month period of moderate expansion to fall back to the contractionary levels which dominated the second half of 2022. Our Roughly Coincident Indicator fell from 92 to 83 in March 2023, while the Lagging Indicator rose from a moderately contractionary reading of 33, to 66. The Roughly Coincident Indicator has been in an uptrend, at varying levels, since October 2020, broken only by a reading of 50 in January 2023. The Lagging Indicator, meanwhile, broke above a predominance of downtrending readings in January of 2022, declining from 83 in December 2022, to 50 in January 2023, 33 in February 2023, and 66 in March.
AIER Business Conditions Monthly (5 years)
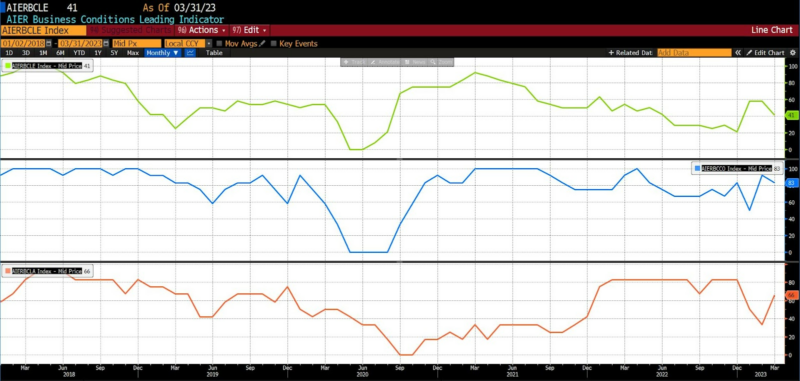
Leading Indicators (41)
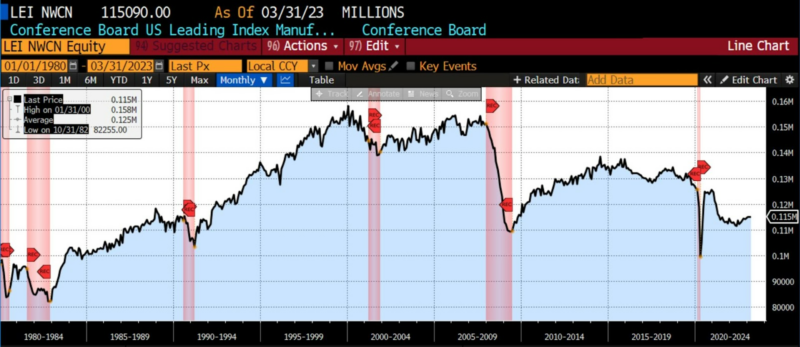
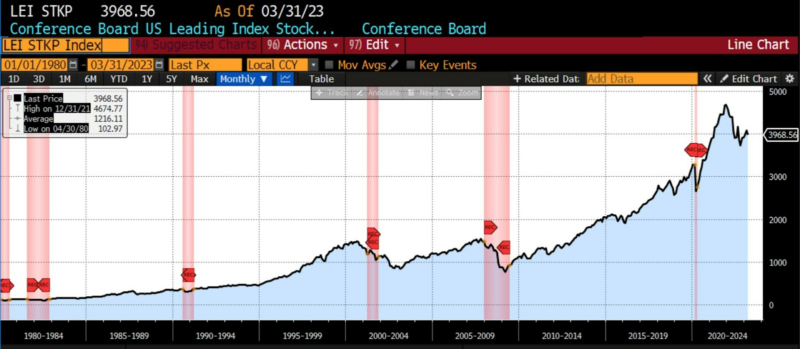
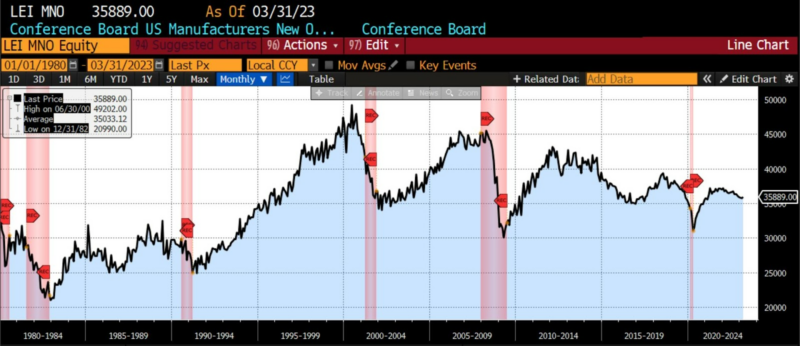
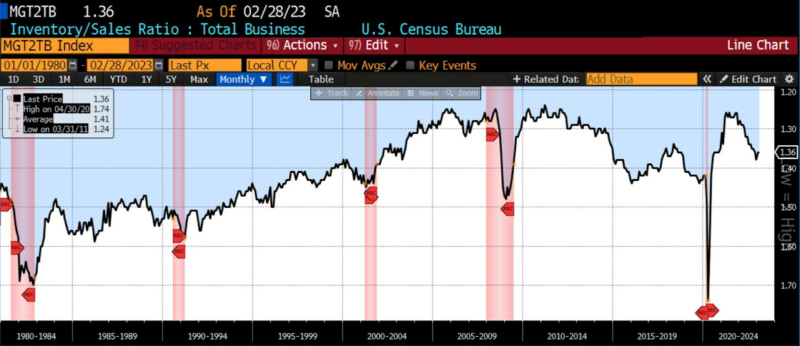
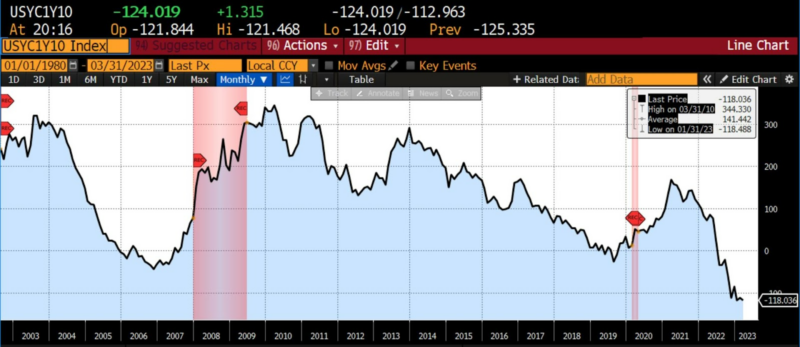
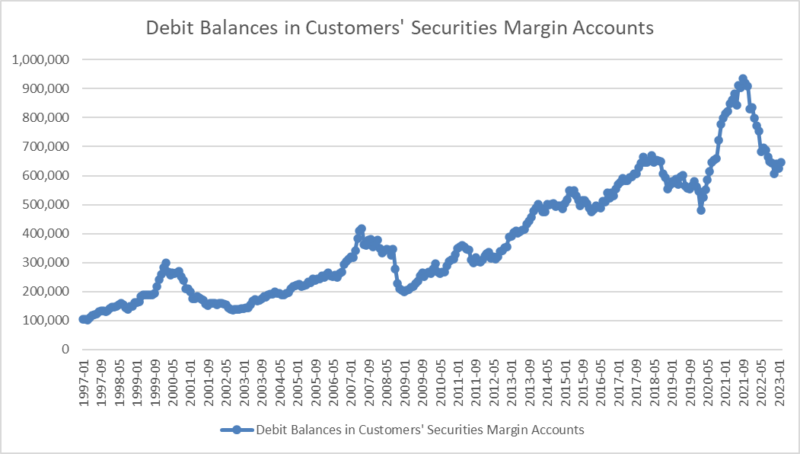
The Leading Indicators continued to generate mixed signals between February and March 2023. Two of the three Conference Board Indices rose in March: the Leading Index of Manufacturers New Orders for Consumer Goods and Materials (0.09 percent) and Manufacturers of New Orders for Nondefense Capital Goods ex. Aircraft (0.45 percent). Debit balances in brokerage margin accounts increased by just over 21,000 (3.4 percent), and the 1-to-10 year US Treasury spread widened by 5 basis points (5.3 percent).
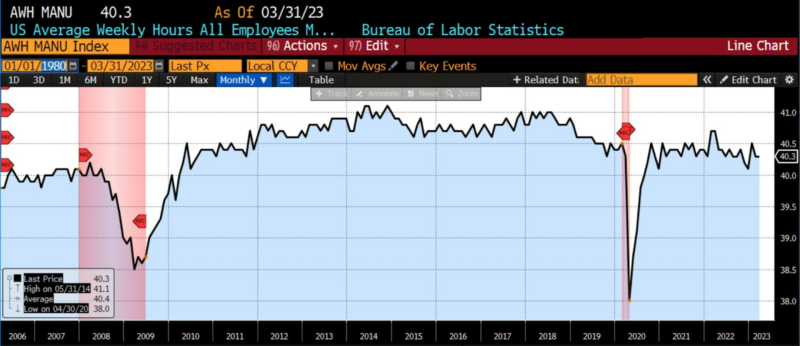
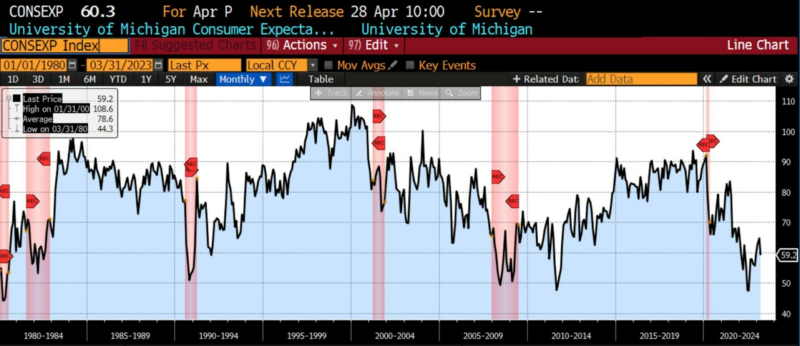
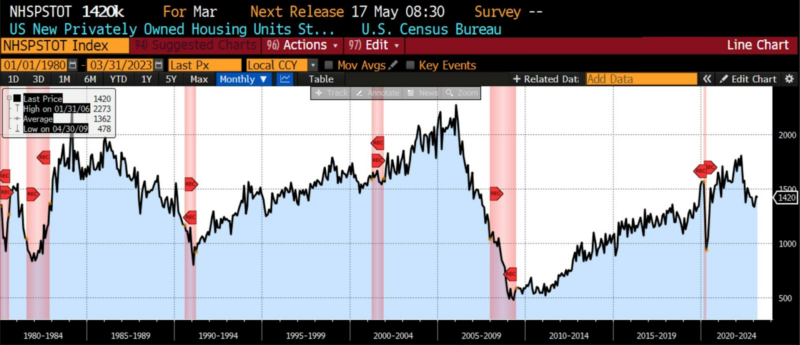
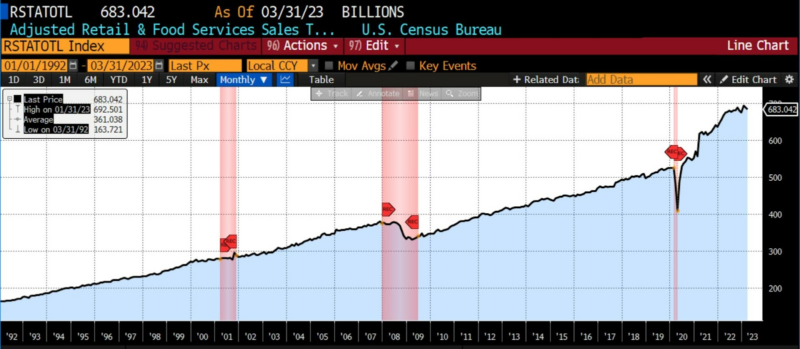
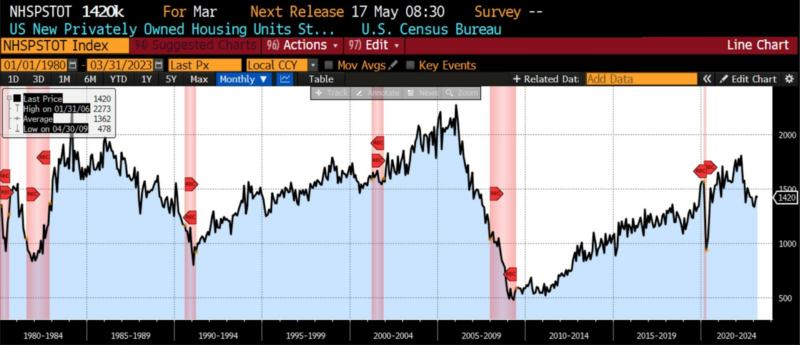
The third of the three Conference Board Indices in our Leading Indicators Index, the Index of Stock Prices of 500 Common Stocks, declined by 2.7 percent. Also falling were the University of Michigan Consumer Expectations Index (-8.5 percent)), New Privately Owned Housing Units Started by Structure (-0.8 percent), Adjusted Retail and Food Services Sales (-0.6 percent), and Heavy Truck Sales (-6.2 percent). Both the US Average Weekly Hours for All Employees Manufacturing and the Inventory/Sales Ratio (Total Business) were essentially unchanged. Unlike the February 2023 readings, ten of twelve constituent indices in our Leading Indicators Index showed significant changes in March 2023, whether positive or negative.
From approximately August 2021 through June 2022, our composite of twelve Leading Indicators maintained a mostly neutral level. Between July and December 2022, that bias shifted into a contractionary trend, which was broken by a shift to moderately expansionary reading in January and February 2023. The return to moderately contractionary readings is likely indicative of several noteworthy developments in March.
Roughly Coincident (83) and Lagging (66) Indicators
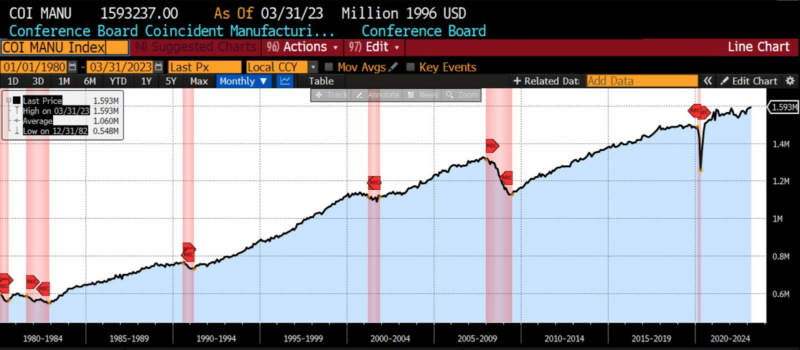
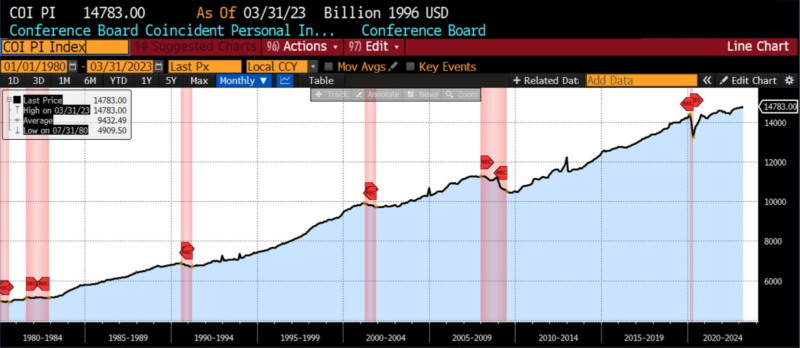
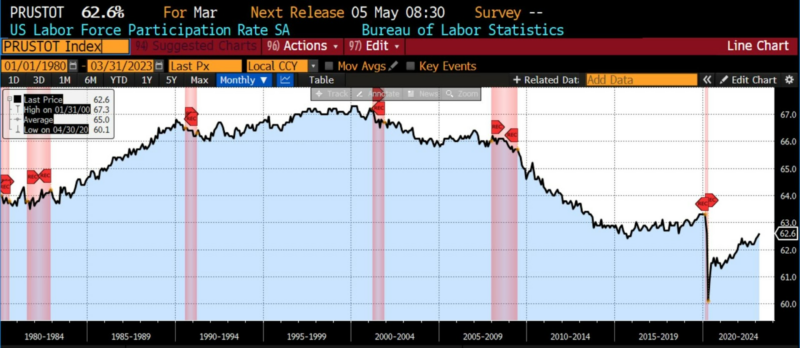
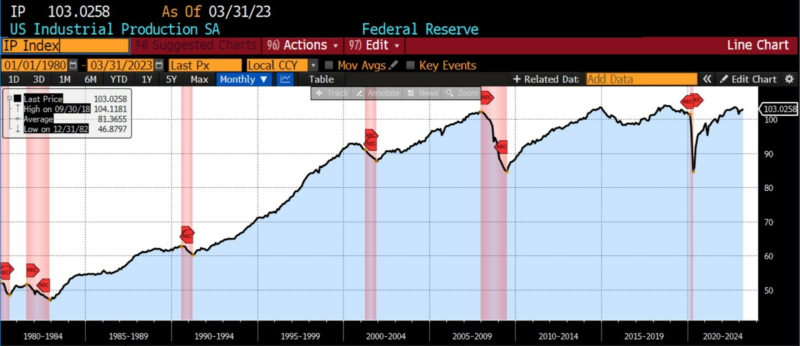
Five of the six indicators in the Coincident Index increased in March 2023. Two of three Conference Board Indices in this category, Manufacturing and Trade Sales and Personal Income Less Transfer Payments, grew by 0.2 percent each. The Conference Board’s Consumer Confidence Present Situation fell by 1.2 percent. Also edging up in March 2023 were US Industrial Production (0.4 percent), US Employees on Nonfarm Payrolls (0.2 percent), and the US Labor Force Participation rate (0.2 percent). Five of these six monthly changes are barely outside the threshold of neutrality, again showing the “churn” in certain economic activity measures discussed last month.
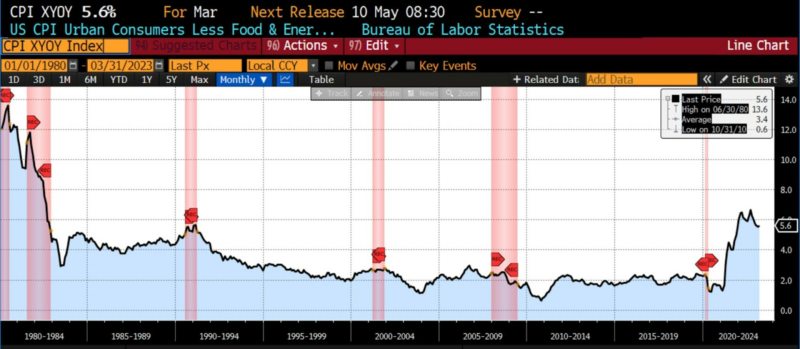
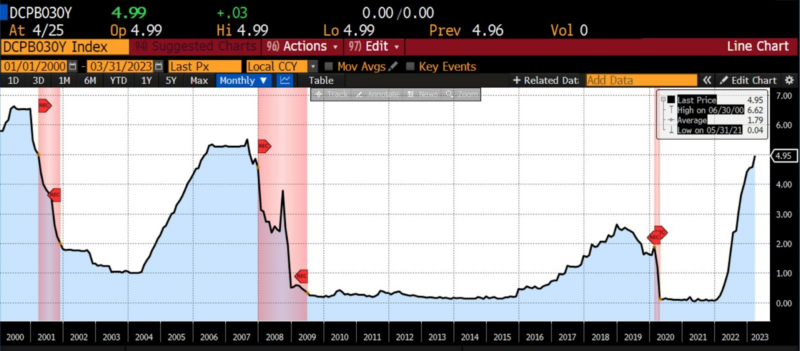
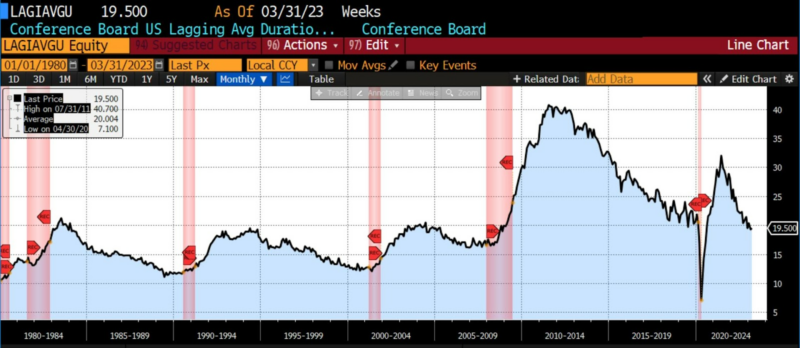
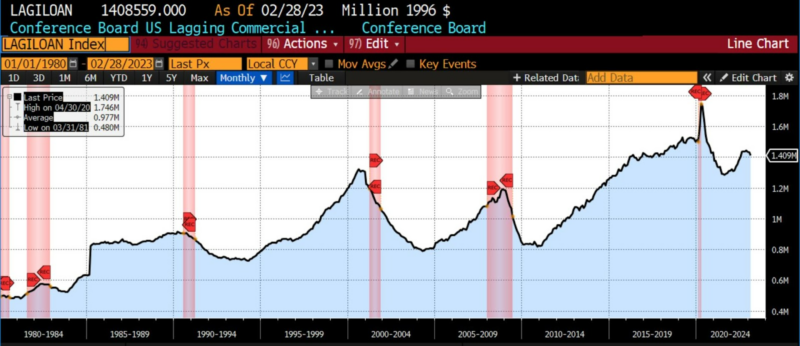
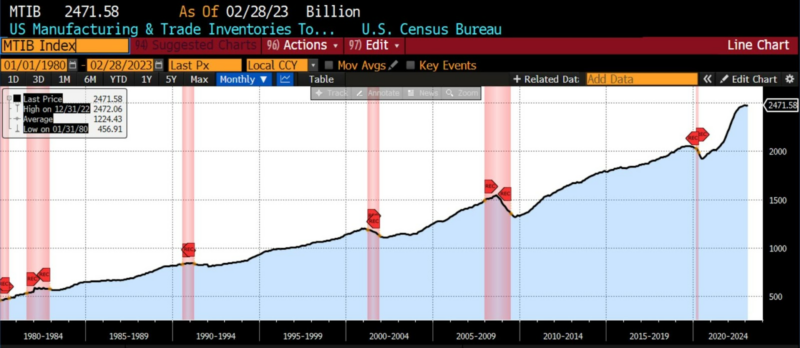
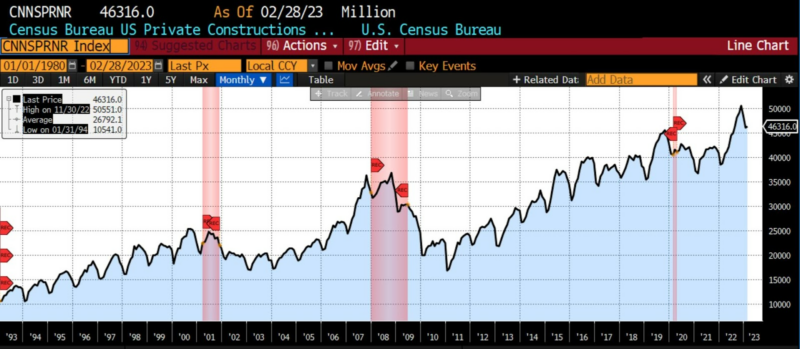
Lagging Indicators varied as well in March, but showed more significant changes. The Conference Board’s Lagging Average Duration of Unemployment rose by 1 percent as Lagging Commercial and Industrial Loans fell by 1.4 percent. The ISM Manufacturing Report on Business Inventories increased by 0.2 percent. The US Census Bureau’s Index of Private Construction Spending (Nonresidential), the US Consumer Price Index ex. Food and Energy (year-over-year), and 30-day average yields rose 0.8 percent, 0.10 percent, and 8.1 percent, respectively.
AIER Business Conditions Monthly (1985 – present)
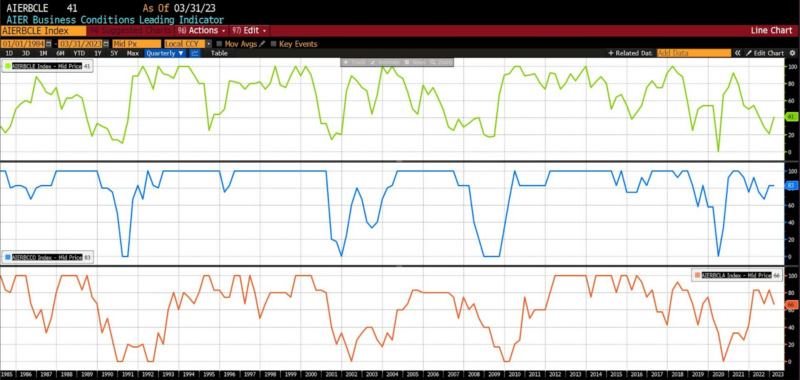
Concerns over decelerating disinflation in the first two months of the year were compounded in March 2023 by a number of high-profile bank failures. The result was tighter credit conditions, and questions regarding whether the Federal Reserve would continue its interest-rate-hiking campaign amid the revelation that US banks have hundreds of billions of dollars in unrealized losses on assets in held-to-maturity accounts. Indeed, despite the unique conditions surrounding the failures of Silicon Valley Bank, Signature Bank, and troubles at First Republic Bank, a constituency has grown urging the Fed to pause or even begin cutting interest rates again. The Federal Open Market Committee voted 11-0 to raise rates 25 basis points (a 4.75 to 5.00 percent Fed Funds target) at their 22 March 2023 meeting, while softening its language somewhat regarding future rate hikes. A presumably final 25 basis point hike is expected at the 2-3 May FOMC meeting.
There are increasing signs that the contractionary monetary policy measures that began in March 2022 are taking effect.
The Institute for Supply Management’s gauge of manufacturing activity fell to its lowest levels since May 2020 in March 2023, which, excluding the COVID pandemic, is its lowest level since 2009. A surprise uptick in industrial production in March is questionable, owing to historic noisiness in the data. Regional economic data from Chicago, Dallas, and Philadelphia showed growing economic weakness as well.
Consumer confidence (as measured by the University of Michigan’s Survey of Consumers) fell in March 2023 for the first time in four months among all demographics, although the drop was sharpest for younger, lower-income, and less-educated groups. While there are likely several reasons for this, foremost is that those groups are the most likely to have been adversely impacted by nearly two years of surging inflation, as well as the unanticipated degree of “stickiness” in service prices, including rents. Inflation expectations in March 2023 stood at 3.6 percent, down from just over 4 percent in February 2023, but still far above average expectations for the two years leading up to the COVID pandemic. Together, the downward trend in consumer confidence accompanied by elevated inflation expectations and higher debt service would be anticipated to impact consumer spending, and in March 2023 that was in evidence. Headline sales dropped 1 percent in March, with weakness visible across many categories: general merchandise, down 3 percent in March versus an 0.9 percent gain in February; discretionary goods (e.g. electronics) down 2.1 percent in March versus a 1.5-percent drop in February; and clothing down 1.7 percent versus a 2-percent decline the prior month. The Confidence Board reported that “consumers plan to spend less on highly discretionary categories such as playing the lottery, visiting amusement parks, going to the movies, personal lodging, and dining.”
Amid a plethora of vacillating economic signals, only a handful of US employment measures (other than inflation) have been consistent over the last several quarters. In March 2023, however, some long-anticipated softness materialized in labor markets. In addition to unseasonably warm weather during the winter of 2022-2023 generating excess hiring (and longer-than-average seasonal retention), thus distorting the employment picture somewhat, tech and finance layoffs accelerated through March. Further, a decline in average weekly hours worked in March offset a wage increase of 0.3 percent in February 2023. And when considering total hours worked (versus number of workers), the decline in the amount of labor used in March 2023 corresponds roughly with 185,000 fewer full-time workers. According to ADP, private payrolls increased 145,000 in March 2023, versus an expected 200,000, and as compared to an increase of 261,000 in February 2023.
Persistent inflation, elevated inflation expectations, and credit tightness on top of the Fed’s contractionary measures are causing trepidation among consumers. One expects that amid high prices and rising debt-service costs, consumers will be increasingly unlikely to tap into excess savings from the pandemic to finance consumption. More troubling is rapidly declining business optimism: in March, the National Federation of Independent Business reported that 25 percent of poll respondents identified ongoing inflation as their biggest problem, with fewer than half (47 percent) expecting better business conditions within the next six months. Delayed, curtailed, or canceled capital expenditure (capex) plans among large US companies similarly suggests dimming growth prospects.
A handful of other current economic and financial indications bear mentioning here.
- Yield-curve inversions
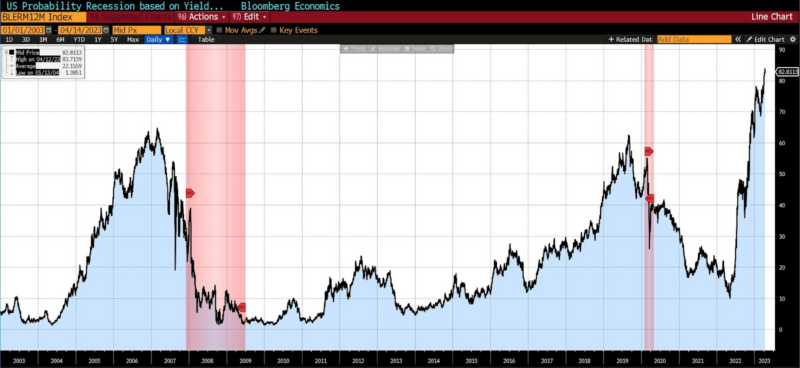
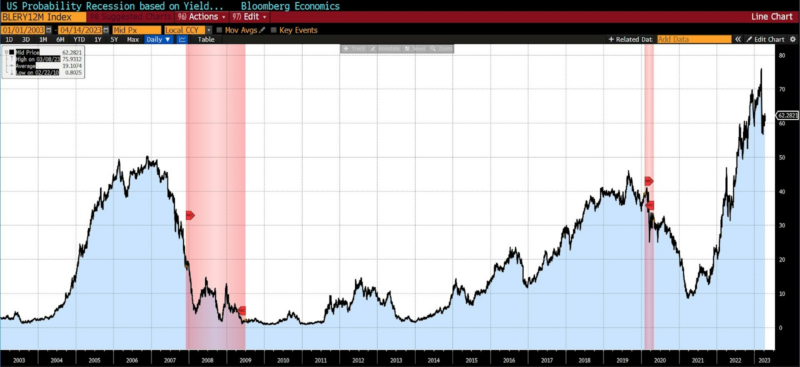
Yield curve inversions are regularly cited as predictors of recessions. They are generally an unreliable method of predicting recessions for reasons (and corresponding to data) shown both in this article and this one. But if many financial market participants are watching them, there may be value in following them. Bloomberg tracks the probability of recessions associated with various yield curve inversions. Three, with their associated predictions of a recession within 12 months, are shown below over a twenty-year period.
US Probability of Recession within 12 months based upon 3mo 10y YC inversion
US Probability of Recession within 12 months based upon 2yr 10y YC inversion
US Probability of Recession within 12 months based upon 3mo 18mo YC inversion
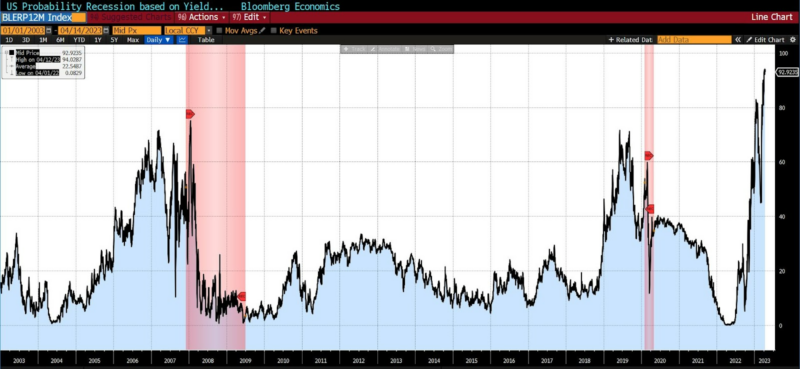
The probability of a recession within the next twelve months associated with each of these three yield curve inversions are, respectively:
83 percent for the 3 mo-10yr;
62 percent for the 2 yr-10 yr;
93 percent for the 3 mo-18 mo.
But the varying lag times of each yield curve inversion associated with the subsequent two recessions since 2003 (and noting that the 2022 recession has not yet been blessed by the National Bureau of Economic Research) leave much to be desired as a predictive indicator. Additionally, in each of the spreads the inversions are presently much greater than those that seem to be associated with past recessions.
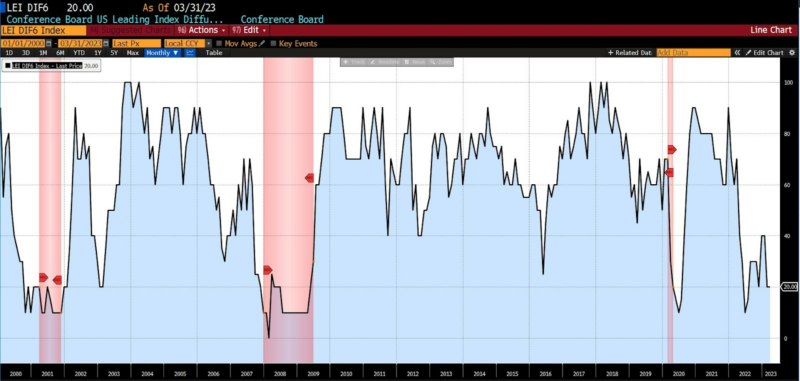
- Leading Index of Employment Diffusion
Various diffusion indices are published by the Conference Board. The 6-month leading index of diffusion shows the breadth of job gains. Breadth of hiring tends to narrow significantly before recessions. The current 6-month employment diffusion is at levels frequently seen before recessions.
Conference Board US Leading Index Diffusion 6-Month Span (2000 – present)
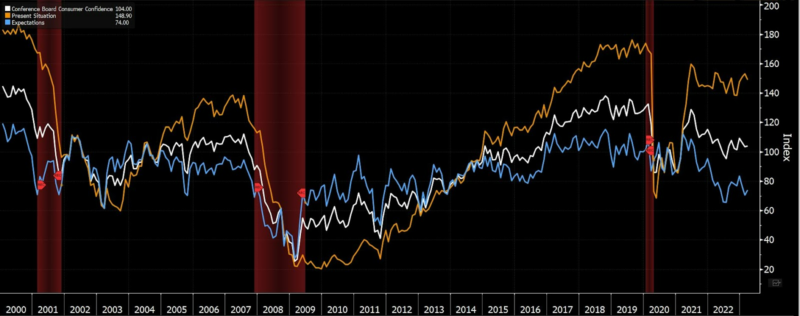
- The Present Situation vs. Expectation “Wedge” in Consumer Confidence
The spread between individuals’ assessment of the present economic situation and their expectations tends to travel in close tandem, but widens with rising uncertainty. That spread tends to widen before recessions, implying more caution in consumption. It is currently at its widest point since before the pandemic.
Present situation (orange) versus Expectations (blue) “wedge” (2000 – present)
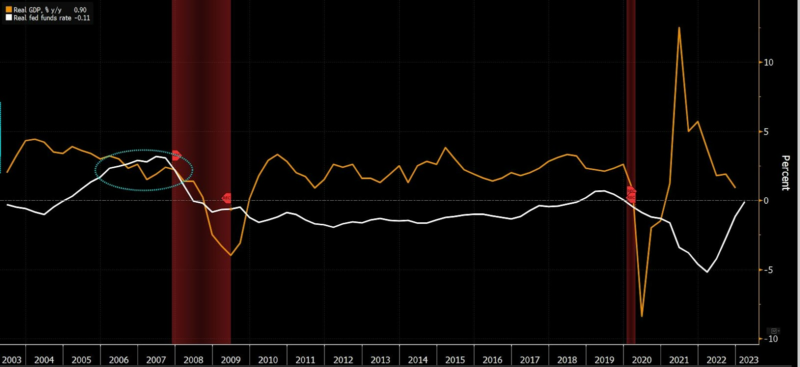
- Economic Growth versus Short-term Interest Rates
Frequently throughout history, when real short-term interest rates have exceeded GDP growth, a recession has followed. At present that is not the case, but with a weak recovery from the brief 2022 recession and short-term rates still climbing, this indicator is one we will be tracking.
Real Interest Rates versus Economic Growth (2003 – present)
- The Earnings Recession
An “earnings recession” occurs when corporate earnings have declined or gone negative for at least two consecutive quarters. As reported in FactSet two days ago:
The (blended) net profit margin for the S&P 500 for Q1 2023 is 11.2 percent, which is below the previous quarter’s net profit margin, below the year-ago net profit margin, and below the 5-year average net profit margin (11.4%). If 11.2 percent is the actual net profit margin for the quarter, it will mark the seventh straight quarter in which the net profit margin for the index has declined quarter-over-quarter. It will also mark the lowest net profit margin reported by the index since Q4 2020 (10.9 percent).
Earnings declines frequently precede recessions.
The bottom line: None of these indicators are conclusive, and all are subject to change or revision, but in the aggregate they serve to buttress an accumulation of economic evidence which prior to March 2023 was more conflicting.
US economic fundamentals are now clearly deteriorating, with risks compounding to the downside. The current baseline estimate is for an economic recession within the next twelve to eighteen months.
Errata: Beginning this month, where possible, charts have been sourced with white backgrounds to make reading easier. Recession start and end dates have been added.
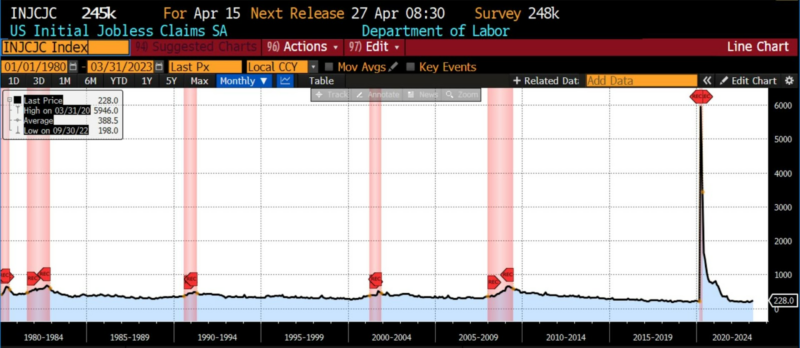
LEADING INDICATORS (1980 – present where possible)

ROUGHLY COINCIDENT INDICATORS (1980 present where possible)

LAGGING INDICATORS (1980 present where possible)
CAPITAL MARKET PERFORMANCE

(All charts and data sourced via Bloomberg Finance, LP)


0 Comments