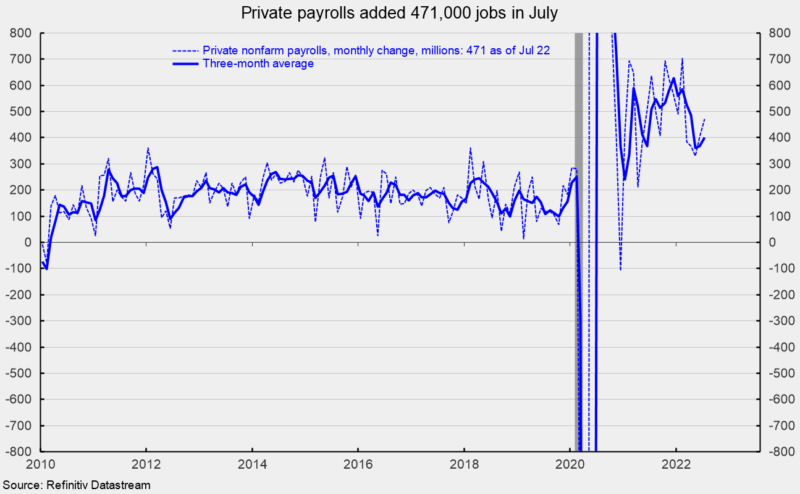
U.S. nonfarm payrolls added 528,000 jobs in July, well above the consensus expectation of 250,000, and the biggest gain since February. Private payrolls posted a 471,000 gain in July versus consensus expectations of 230,000 and also the biggest gain since February (see first chart). Overall, the jobs report is a positive result.
Despite the strong results, a substantial preponderance of recent data suggest headwinds for the economy. An aggressive Fed tightening cycle, near-record-low consumer attitudes, rising initial claims for unemployment insurance, and a weakening housing market offset some of the positive effects of the strong July jobs report. Furthermore, ongoing disruptions to global supply chains add to the headwinds. Caution is still warranted.
Gains in recent months continue to be broad-based. Within the 471,000 gain in private payrolls, private services added 402,000 versus a 12-month average of 424,200 while goods-producing industries added 69,000 versus a 12-month average of 71,100.
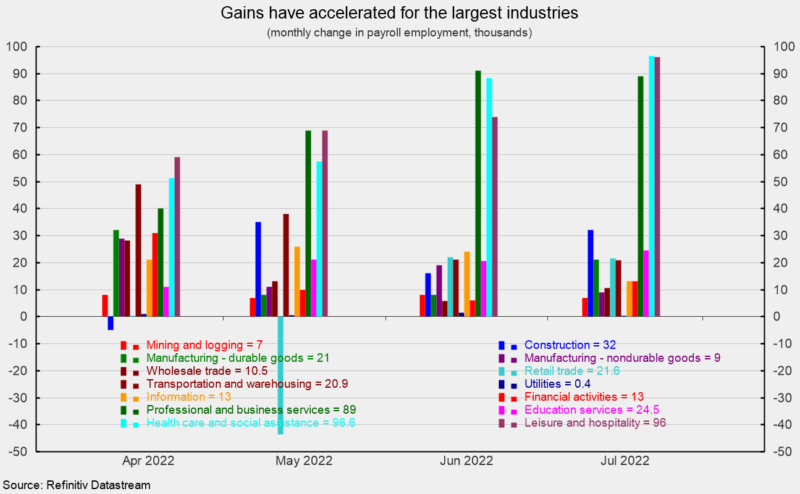
Within private service-producing industries, education and health services increased by 122,000 (versus a 66,300 twelve-month average), leisure and hospitality added 96,000 (versus 126,500), business and professional services added 89,000 (versus 96,100), retail employment rose by 21,600 (versus 33,900), transportation and warehousing added 20,900 jobs (versus an average 36,500), information services gained 13,000 (versus 16,100), and wholesale trade gained 10,500 (versus 14,900;see second chart).
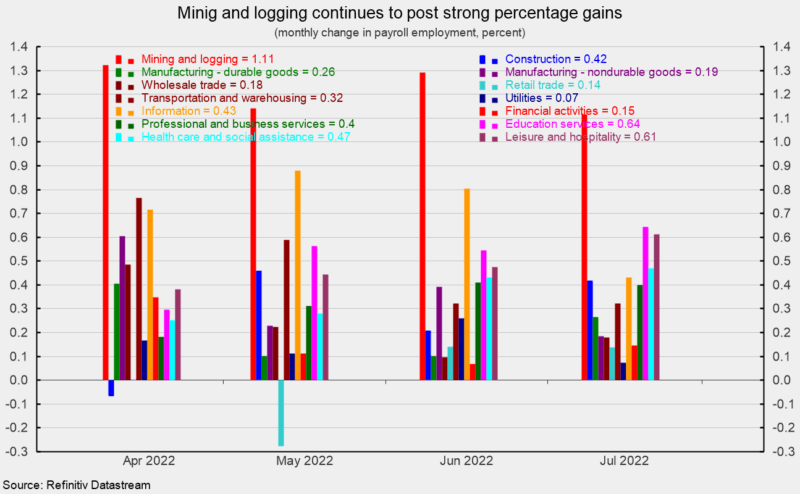
Within the 69,000 gain in goods-producing industries, construction added 32,000, durable-goods manufacturing increased by 21,000, nondurable-goods manufacturing added 9,000, and mining and logging industries increased by 7,000 (see second chart). While actual monthly private payroll gains are dominated by a few of the services industries, monthly percent changes paint a slightly different picture. Mining and logging industries have recently posted strong monthly percentage gains (see third chart).
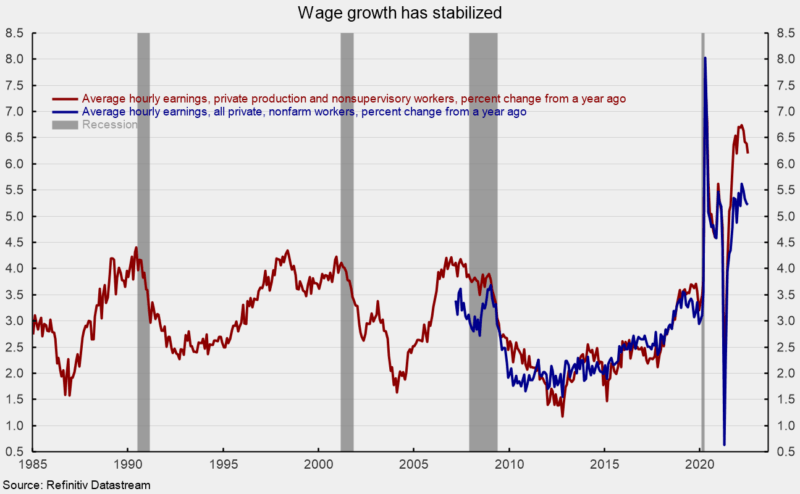
Average hourly earnings for all private workers rose 0.5 percent in July, putting the 12-month gain at 5.2 percent, about steady since October 2021 (see fourth chart). The average hourly earnings for private, production and nonsupervisory workers rose 0.4 percent for the month and are up 6.2 percent from a year ago, also about in line with results over the last ten months (see fourth chart). The average workweek for all workers was unchanged at 34.6 hours in July while the average workweek for production and nonsupervisory held at 34.0 hours.
Combining payrolls with hourly earnings and hours worked, the index of aggregate weekly payrolls for all workers gained 0.9 percent in July and is up 9.7 percent from a year ago; the index for production and nonsupervisory workers rose 0.8 percent and is 10.3 percent above the year ago level. The total number of officially unemployed was 5.670 million in July, a drop of 242,000. The unemployment rate fell to 3.5 percent from 3.6 percent in June while the underemployed rate, referred to as the U-6 rate, remained unchanged at 6.7 percent in July.
The employment-to-population ratio, one of AIER’s Roughly Coincident indicators, came in at 60.0 percent for July, up 0.1 percentage points but still significantly below the 61.2 percent in February 2020.
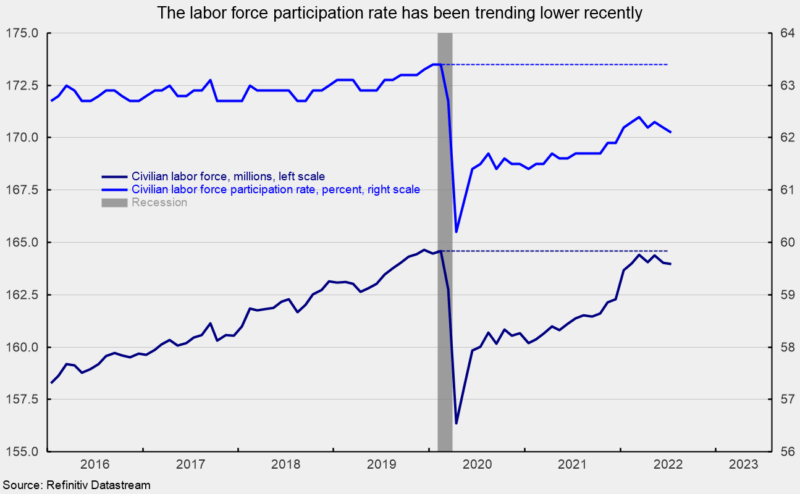
The labor force participation rate ticked down again, falling 0.1 percentage point in July, to 62.1 percent. This important measure has been trending lower in recent months after hitting a pandemic high of 62.4 in March 2022 and is still well below the 63.4 percent of February 2020 (see fifth chart).
The total labor force came in at 164.0 million, down 63,000 from the prior month and 623,000 below the February 2020 level of 164.6 million (see fifth chart). If the 63.4 percent participation rate were applied to the current population, an additional 3.4 million workers would be available.
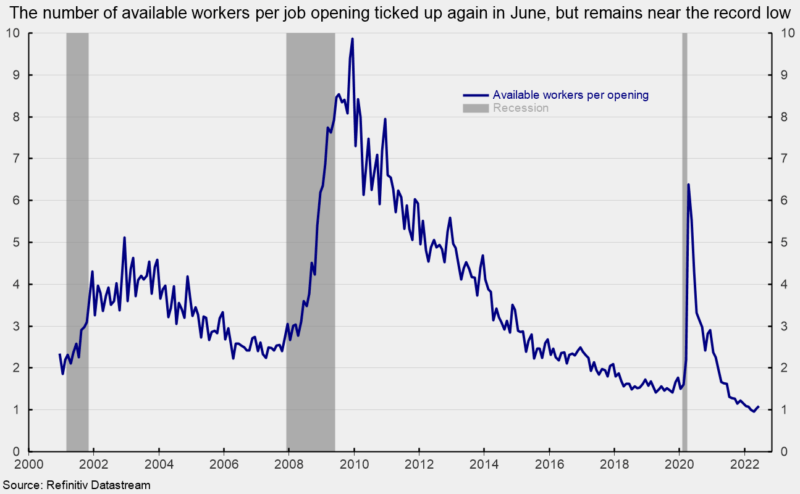
The weaker participation rate is one reason the labor market remains so tight. Based on the latest Job Openings and Labor Turnover Survey (JOLTS), there is 1.092 available workers for each opening, up just slightly from the record low of 0.957 in April (see sixth chart). The latest Job Openings and Labor Turnover Survey from the Bureau of Labor Statistics shows the total number of job openings in the economy decreased to 10.698 million in June, down from 11.303 million in May; openings were a record-high 11.855 million in March.
The number of open positions in the private sector decreased to 9.766 million in June, down from 10.275 million in May and a record-high 10.812 million in March. June was also the first month below 10 million since November 2021 and the lowest level since September 2021.
The July jobs report shows total nonfarm and private payrolls posted surprisingly strong gains. However, the upward trend in weekly initial claims for unemployment insurance and continued decline in the number of job openings and quits in June suggest offset some of the positive effects of the July jobs report.
Persistently elevated rates of rising prices are weighing on consumer attitudes and may be starting to impact spending patterns as well. Furthermore, an intensifying cycle of Fed policy tightening is increasing borrowing costs for consumers and businesses alike. At the same time, fallout from the Russian invasion of Ukraine continues to disrupt global supply chains. The outlook remains highly uncertain, and caution is warranted.


0 Comments