Summary
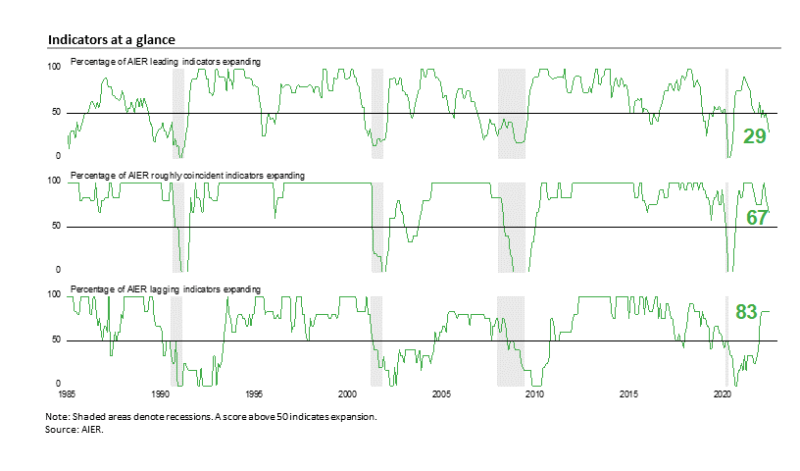
AIER’s Leading Indicators Index fell thirteen points to a reading of 29, the lowest level since August 2020. The latest reading is well below the neutral 50 threshold and is consistent with broadening weakness in the economy and significantly elevated risks for the outlook. The results underscore the recent advance estimate of second quarter real Gross Domestic Product, which showed a second consecutive, albeit small, quarterly decline. It should be noted that the advance estimate is based on preliminary and incomplete data and will likely be revised. Even if the estimate for second quarter real GDP is revised to show growth, there is substantial and growing evidence of broadening weakness in the U.S. economy.
Persistently elevated rates of price increases and an intensifying Fed tightening cycle are impacting economic activity. Consumer attitudes and real consumer spending are weakening, and higher mortgage rates are weighing on housing. While the strong labor market continues to provide some support for consumer incomes, there are also some signs of softening for the labor market. Overall, the outlook remains highly uncertain. Caution is warranted.
AIER Leading Indicators Index Falls to 29 in July, Signaling Major Risks
The AIER Leading Indicators index posted a decline in July, dropping thirteen points to 29. The July result is down 62 points from the March 2021 high of 92 and is the lowest level since August 2020 during the recovery from the lockdown recession. In recent business cycles, the Leading Indicators Index has fallen into the twenties-range five times since 1985. In four of those instances, a recession followed within about 12 months. The exception was in 1995 when no recession was declared but real GDP growth slowed significantly. With the latest reading now well below the neutral 50 threshold, the AIER Leading Indicators Index is signaling broadening weakness in the economy and significantly elevated risks for the outlook.
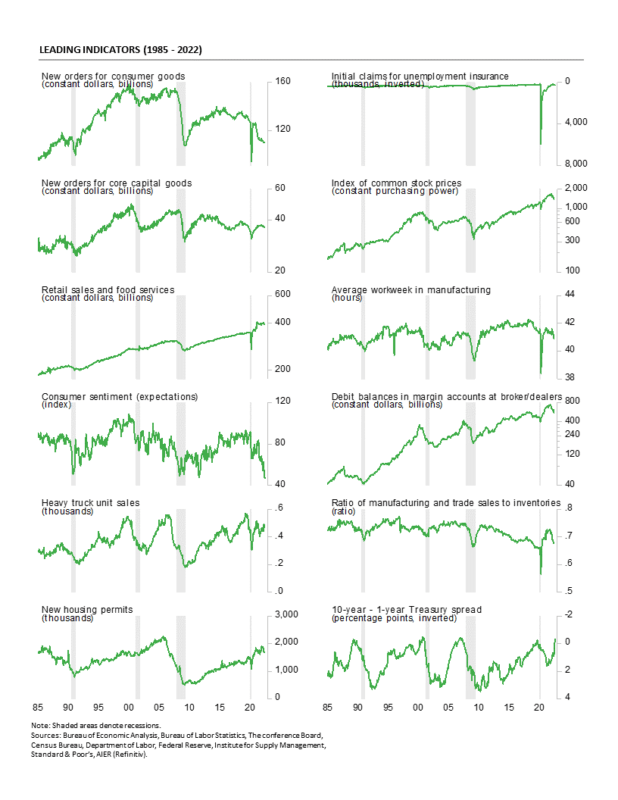
Three leading indicators changed signal in July. The trend in the real retail sales indicator reversed course, falling to neutral following improvements over the first six months of 2022. Over the first six months of the year, the real retail sales indicator was trending lower in January and February, trending flat in March and April, and trending higher in May and June. However, actual real total retail sales have fallen in three of the last four months, including drops of 0.3 percent (adjusted using the CPI) in June and 1.1 percent in May. With consumer spending being such a large part of the U.S. economy, future developments in this indicator will be critically important.
The housing permits indicator weakened for a second consecutive month, falling to a negative trend in July from a neutral trend in June and a positive trend in May. Given the sharp rise in mortgage rates and elevated home prices, this is not a surprising development. New home sales, existing home sales, and homebuilder sentiment data point to softening activity as well.
The average workweek in manufacturing fell to a negative trend in July from a neutral trend in June. The length of the average workweek for production and nonsupervisory employees fell to 40.9 hours in June, down from 41.2 hours in May. The workweek had been as high as 41.6 hours in February 2022 and 41.7 in March 2021 but is now at the lowest level since September 2020. During the last economic expansion, the workweek averaged 41.8 hours from 2011 through 2019.
Among the 12 leading indicators, three were in a positive trend in July while eight were trending lower and one was trending flat or neutral.
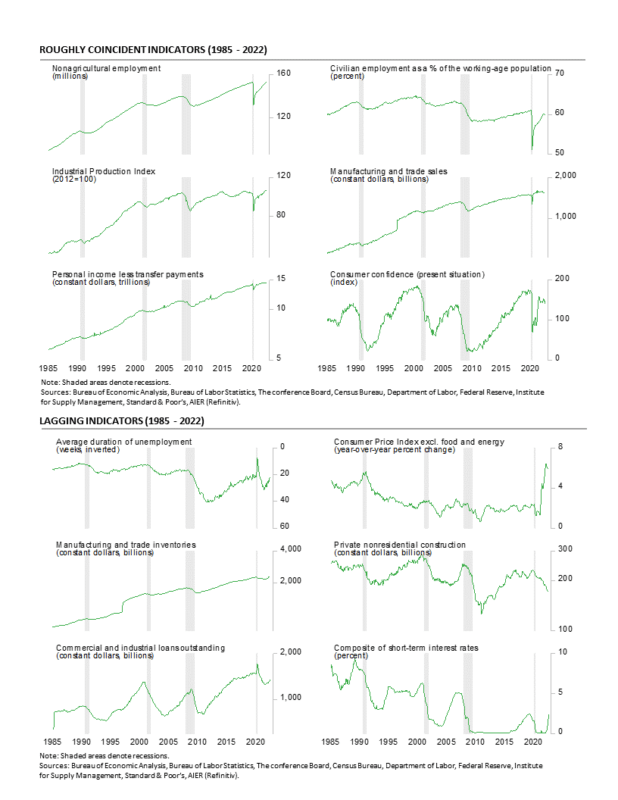
The Roughly Coincident Indicators index posted a third consecutive decline in July, dropping to a reading of 67 from 75 in May, 83 in May, and a perfect 100 in April. One indicator weakened in July. The Conference Board Consumer Confidence in the Present Situation fell from a neutral trend to a negative trend. Most measures of consumer attitudes are weakening, primarily a result of persistent, elevated rates of price increase.
In total, four roughly coincident indicators – nonfarm payrolls, employment-to-population ratio, industrial production, and real personal income excluding transfers were trending higher in July while two – the real manufacturing and trade sales indicator and the Conference Board Consumer Confidence in the Present Situation indicator – were in negative trends; none were in a flat or neutral trend. Given the weakening in the AIER Leading Indicators Index, it would not be surprising to see further declines in the Roughly Coincident Index in coming months.
AIER’s Lagging Indicators index was unchanged for the sixth consecutive month, holding at 83 in July. February through July was the best five-month run since June through October 2018. No individual indicators changed trend for the month. In total, five indicators were in favorable trends, one indicator had an unfavorable trend, and none had a neutral trend.
Overall, the AIER Leading Indicators Index is well below neutral, signaling broadening weakness in the economy and sharply elevated levels of risk for the outlook. Consumer spending is facing strengthening headwinds from elevated rates of price increases and declining confidence while housing is showing signs of fatigue as record home prices and higher mortgage rates temper demand. Businesses may be losing confidence in the economic outlook as well given the pullback in capital spending, and there are growing indications of deteriorating global economic activity. Furthermore, the Fed has intensified the current policy tightening cycle, raising the risk of a policy mistake, and the fallout from the Russian invasion of Ukraine continues to disrupt global supply chains. Caution is warranted.
U.S. Posts Second Consecutive Drop in Real GDP
Real gross domestic product fell at a 0.9 percent annualized rate in the second quarter versus a 1.6 percent rate of decline in the first quarter. Over the past four quarters, real gross domestic product is up 1.6 percent.
Real final sales to private domestic purchasers, a key measure of private domestic demand, has shown greater resilience. It was unchanged in the second quarter following a 3.0 percent pace of increase in the first quarter. Over the last four quarters, real final sales to private domestic purchasers are up 1.7 percent. Note that the data shown in the current report are based on incomplete information and will likely be revised in subsequent releases.
Declines were widespread in the second quarter. Among the components, real consumer spending overall rose at a 1.0 percent annualized rate, the slowest pace since the lockdown recession, and contributed a total of 0.7 percentage points to real GDP growth. Consumer services led the growth in overall consumer spending, posting a 4.1 percent annualized rate, adding 1.78 percentage points to total growth. Durable-goods spending fell at a 2.6 percent pace, subtracting 0.22 percentage points while nondurable-goods spending fell at a -5.5 percent pace, subtracting 0.85 percentage points. Within consumer services, growth was broadly strong, led by food services and accommodation (13.5 percent), recreation (7.4 percent), and other services (6.6 percent growth rate).
Business fixed investment decreased at a 0.1 percent annualized rate in the second quarter of 2022, subtracting 0.01 percentage points from final growth. Intellectual-property investment rose at a 9.2 percent pace, adding 0.47 points to growth while business equipment investment fell at a -2.7 percent pace, subtracting 0.16 percentage points, and spending on business structures fell at an 11.8 percent rate, the fifth decline in a row, and subtracting 0.32 percentage points from final growth.
Residential investment, or housing, fell at a 14.0 percent annual rate in the second quarter compared to a 0.4 annualized gain in the prior quarter. The drop in the second quarter subtracted 0.71 percentage points.
Businesses added to inventory at an $81.6 billion annual rate (in real terms) in the second quarter versus accumulation at a $188.5 billion rate in the second quarter. The slower accumulation reduced second-quarter growth by a very sizable 2.01 percentage points. The inventory accumulation helped boost the real nonfarm inventory to real final sales of goods and structures ratio to 4.07 from 4.0 in the first quarter; the ratio hit a low of 3.75 in the second quarter of 2021. The latest result is still below the 4.3 average for the 16 years through 2019 but suggests further progress towards a more favorable supply/demand balance.
Exports rose at an 18.0 percent pace while imports rose at a 3.1 percent rate. Since imports count as a negative in the calculation of gross domestic product, a gain in imports is a negative for GDP growth, subtracting 0.49 percentage points in the second quarter. The rise in exports added 1.92 percentage points. Net trade, as used in the calculation of gross domestic product, contributed 1.43 percentage points to overall growth.
Government spending fell at a 1.9 percent annualized rate in the second quarter compared to a 2.9 percent pace of decline in the first quarter, subtracting 0.33 percentage points from growth.
Consumer price measures showed another rise in the second quarter. The personal-consumption price index rose at a 7.1 percent annualized rate, matching the first quarter. From a year ago, the index is up 6.5 percent. However, excluding the volatile food and energy categories, the core PCE (personal consumption expenditures) index rose at a 4.4 percent pace versus a 5.2 percent increase in the first quarter and is the slowest pace of rise since the first quarter of 2021. From a year ago, the core PCE index is up 4.8 percent.
Real Retail Sales Decline for the Third Time in Four Months
Retail sales and food-services spending rose 1.0 percent in June following a 0.1 percent decline in May. From a year ago, retail sales are up 8.4 percent. Total nominal retail sales remain well above the pre-pandemic trend.
However, these data are not adjusted for price changes. In real terms, total retail sales were down 0.3 percent (adjusted using the CPI) in June following a 1.1 percent decrease in May. Real retail sales have declined in three of the last four months. From a year ago, real total retail sales are down 0.5 percent. As with nominal retail sales, real retail sales remain well above trend but since March 2021, real retail sales have been trending essentially flat.
Core retail sales, which exclude motor vehicle dealers and gasoline retailers, rose 0.7 percent for the month following a 0.1 percent drop in May. Those leave that measure with a 6.6 percent increase from a year ago.
After adjusting for price changes, real core retail sales remained unchanged in June after a 0.7 percent decline in May. From a year ago, real core retail sales are up a meager 0.6 percent and have also been trending essentially flat since March 2021.
Categories were generally higher in nominal terms for the month with nine up and four down in June. The gains were led by gasoline spending, up 3.6 percent for the month. However, the average price for a gallon of gasoline was $5.15, up 9.7 percent from $4.70 in May, suggesting price changes more than accounted for the rise. Nonstore retailers (2.2 percent), furniture and home furnishings (1.4 percent), and miscellaneous retailers (1.4 percent) also posted strong nominal-dollar gains. Building materials, gardening equipment and supplies led the declining group with a 0.9 percent drop followed by clothing and accessory stores with a 0.4 percent drop.
Overall, retail sales rose 1.0 percent for the month in nominal terms and remain well above trend. Excluding autos and gas, nominal core retail sales posted a 0.7 percent gain. However, rising prices are still providing a significant boost to the numbers. In real terms, total retail sales fell, and core retail sales were essentially flat for the month with both trending essentially flat since March 2021.
New Single-Family Home Sales Fall for the Fifth Time in Six Months
Sales of new single-family homes declined in June, falling 8.1 percent to 590,000 at a seasonally-adjusted annual rate from a 642,000 pace in May. The June fall was the fifth drop in the last six months, leaving sales down 29.7 percent from the December 2021 level, and down 43 percent from the August 2020 post-recession peak.
Sales of new single-family homes were down in three of the country’s four regions in June. Sales in the South, the largest by volume, fell 2.0 percent, while sales in the Northeast, the smallest region by volume, fell 5.3 percent, and sales in the West decreased 36.7 percent. Sales in the Midwest jumped 42.3 percent for the month. Over the last 12 months, sales were down across all four regions, led by a 37.9 percent fall in the Northeast, followed by a 32.9 percent drop in the West, a 22.1 percent decrease in the Midwest, and an 8.7 percent retreat in the South.
The median sales price of a new single-family home was $402,400, down from $444,500 in May and a record high $457,000 in April (not seasonally adjusted). Meanwhile, 30-year fixed rate mortgages were 5.51 percent in late July, up sharply from a low of 2.65 percent in January 2021. The combination of high prices and rising mortgage rates is reducing affordability and squeezing some buyers out of the market.
The total inventory of new single-family homes for sale rose 2.2 percent to 457,000 in June, the highest since April 2008. That puts the months’ supply (inventory times 12 divided by the annual selling rate) at 9.3, up 10.7 percent from May, 60.3 percent above the year-ago level, and the highest since May 2010. The months’ supply is very high by historical comparison. The high level of prices, elevated months’ supply, and surge in mortgage rates should weigh on housing activity in the coming months and quarters. However, the median time on the market for a new home remained very low in June, coming in at 2.5 months versus 2.7 in May.
Single-Family Home Construction Retreat Continued in June
Total housing starts fell to a 1.559 million annual rate in June from a 1.591 million pace in May, a 2.0 percent drop. From a year ago, total starts are down 6.3 percent. Total housing permits also fell in June, posting a 0.6 percent drop to 1.685 million versus 1.695 million in May. Total permits are still up 1.4 percent from the June 2021 level.
Starts in the dominant single-family segment posted a rate of 982,000 in June versus 1.068 million in May, a drop of 8.1 percent. That is the slowest pace and first month under one million since June 2020. Starts are down 15.7 percent from a year ago. Single-family permits fell 8.0 percent to 967,000 versus 1.051 million in May, also the slowest pace and first month under one million since June 2020.
However, starts of multifamily structures with five or more units increased 15.0 percent to 568,000 and are up 16.4 percent over the past year while starts for the two- to four-family-unit segment plunged 69.0 percent to a 9,000-unit pace versus 29,000 in May. Total multifamily starts were up 10.3 percent to 577,000 in June, showing a gain of 15.6 percent from a year ago.
Multifamily permits for the 5-or-more group rose 13.1 percent to 666,000 while permits for the two-to-four-unit category decreased 5.5 percent to 52,000. Total multifamily permits were 718,000, up 11.5 percent for the month and up 26.0 percent from a year ago.
Meanwhile, the National Association of Home Builders’ Housing Market Index, a measure of homebuilder sentiment, fell again in July, coming in at 55 versus 67 in June. That is the seventh consecutive drop and the second-largest monthly decline in the index’s history, putting the result at the lowest reading since May 2020. The index is down sharply from recent highs of 84 in December 2021 and 90 in November 2020.
According to the report, “Builder confidence plunged in July as high inflation and increased interest rates stalled the housing market by dramatically slowing sales and buyer traffic.” The report adds, “In another sign of a softening market, 13% of builders in the HMI survey reported reducing home prices in the past month to bolster sales and/or limit cancellations.”
All three components of the Housing Market Index fell again in July. The expected single-family sales index dropped to 50 from 61 in the prior month, the current single-family sales index was down to 64 from 76 in June, and the traffic of prospective buyers index sank again, hitting 37 from 48 in the prior month.
Input costs are still a concern for builders though lumber and copper prices have declined from recent highs. Lumber recently traded around $650 per 1,000 board feet in mid-July, down from peaks around $1,700 in May 2021 and $1,500 in early March 2022. Copper prices were down to $7,400 per metric ton.
While the implementation of permanent remote working arrangements for some employees may have been providing continued support for housing demand, record-high home prices combined with the surge in mortgage rates and falling consumer attitudes are working to weaken demand. Pressure on housing demand combined with elevated input costs is sending homebuilder sentiment plunging. The outlook for housing is deteriorating rapidly.
Weekly Initial Claims Continue to Trend Higher
Initial claims for regular state unemployment insurance fell 5,000 for the week ending July 23rd, coming in at 256,000. The previous week’s 261,000 was revised up from the initial tally. However, by long-term historical comparison, initial claims remain very low.
The four-week average rose for the fifteenth time in the last sixteen weeks (the four-week average was unchanged in one week), coming in at 249,250, up 6,250 from the prior week and at the highest level since December. Weekly initial claims data continue to suggest a tight labor market, though the recent sustained upward trend indicates some easing.
The number of ongoing claims for state unemployment programs totaled 1.448 million for the week ending July 9th, a rise of 122,465 from the prior week. State continuing claims are also trending higher over the last several weeks.
The latest results for the combined Federal and state programs put the total number of people claiming benefits in all unemployment programs at 1.476 million for the week ended July 9th, an increase of 123,430 from the prior week. The latest result is the twenty-second week in a row below 2 million.
Initial claims remain at a very low level by historical comparison, but a clear upward trend has emerged, suggesting that, on the margin, the labor market has begun to loosen. Weekly initial claims for unemployment insurance is an AIER leading indicator, and remained a favorable contributor in the July update. However, given the upward trajectory, it will likely turn to a neutral position in coming updates. Furthermore, the number of open jobs in the country has receded for three consecutive months, though the level remains very high by historical comparison.
While the overall low level of claims combined with the high number of open jobs suggests the labor market remains solid, both measures are showing signs of softening. The tight labor market is a crucial component of the economy, providing support for consumer spending. However, persistently elevated rates of price increases already weigh on consumer attitudes, and if consumers lose confidence in the labor market, they may significantly reduce spending.
Private-Sector Job Openings and Quits Fall for a Third Consecutive Month
The latest Job Openings and Labor Turnover Survey from the Bureau of Labor Statistics shows the total number of job openings in the economy decreased to 10.698 million in June, down from 11.303 million in May; openings were a record-high 11.855 million in March.
The number of open positions in the private sector decreased to 9.766 million in June, down from 10.275 million in May and a record-high 10.812 million in March. June was also the first month below 10 million since November 2021 and the lowest level since September 2021.
The total job openings rate, openings divided by the sum of jobs plus openings, fell to 6.6 percent in June from 6.9 percent in May while the private-sector job-openings rate fell to 7.0 percent from 7.4 percent in the previous month. The June result for the private sector is the lowest since June 2021.
Two industry categories still have more than 2.0 million openings each: education and health care (2.246 million) and professional and business services (2.009 million). Trade, transportation, and utilities (1.651 million) and leisure and hospitality (1.451 million) are above 1 million.
The highest openings rates were in leisure and hospitality (8.5 percent), education and health care (8.4 percent), professional and business services (8.3 percent). Manufacturing (5.8 percent) and transportation, and utilities, trade (5.4 percent) also remain elevated.
The number of private-sector quits fell in June, coming in at 3.999 million, down from 4.048 million in May. Trade, transportation, and utilities led with 950,000 quits, followed by leisure and hospitality with 848,000 quits, and professional and business services with 738,000.
The total quits rate was unchanged at 2.8 percent for the month while the private-sector quits rate held at 3.1 percent. The current private-sector quits rate is the lowest since October 2021 and 0.3 percentage points below the record high 3.4 percent in November 2021.
The quits rates among the private-sector industry groups are still dominated by leisure and hospitality with a rate of 5.4 percent, well ahead of professional and business services and trade transportation, and utilities, both with a 3.3 percent quits rate.
The number of job seekers (unemployed plus those not in the labor force but who want a job) per opening ticked up slightly again in June, rising to 1.092 in June from 1.028 in May and a record low 0.957 in April. Before the lockdown recession, the low was 1.409 in October 2019.
The job openings data add to the significant range of evidence that suggest the economy is weakening. While the still-large number of openings suggest the labor market remains tight, the deterioration at the margin is warning sign.


0 Comments