Excessive, invasive, and arbitrary government power tends to undermine the performance of an economy and the stock prices of its major companies. In such a setting one might suspect that divided partisan control of government – “gridlock” – can mitigate potential policy harm. That is exactly what the evidence confirms, regarding equities, at least over the past 50 years. But in America, at the national level, we no longer have divided government.
Many policy factors beyond partisan control influence equities: monetary, fiscal, trade, regulatory, and foreign policy. Still, it is worth consulting the relationship between the policy mix, partisan mix, and equities. Below I summarize the returns which have accompanied three types of partisan control in America: full control by Democrats, full control by Republicans, and mixed control.
By “full control” I mean one or the other of America’s top two parties controlling not only the White House but also (simultaneously) the U.S. Senate and U.S. House of Representatives. This is relevant again, as we now have one-party rule at the federal level. Democrats again are in full control. Yes, the Senate is tied at 50-50, but its president (the Vice President) has the power to break vote ties; the party in control of the White House technically also controls the Senate.
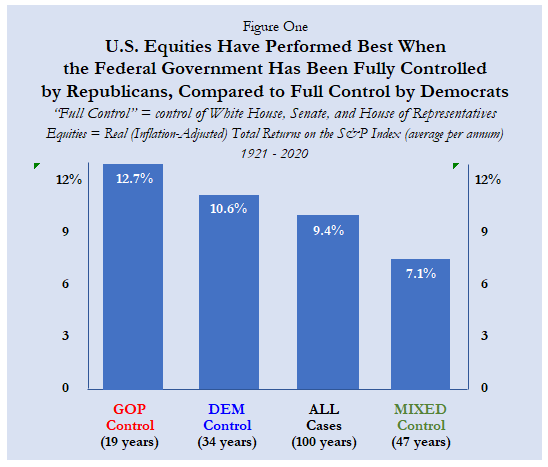
In modern America (over the past century), single-party control has been more common than you might suspect; it has occurred 53% of the time since 1921, with the balance of the 100 years (47% of them) characterized by mixed control. The reason people today might suspect that mixed control is the “norm” reflects the fact that it has been more common (70% of the time) over the past fifty years (1971-2020), compared to only 24% of the time during the period 1921-1970.
Summaries of the empirics are provided in Figure One and Table One. In Figure One notice that equity performance has been superior, on average over the entire past century, when Republicans were in full control (19 years): in those years, the real (inflation-adjusted) return on the S&P index averaged 12.7% p.a., compared to 10.6% p.a. when Democrats were in full control (34 years), only 9.4% p.a. for all 100 years, and a mere 7.1% p.a. for all years of mixed control (47 years).

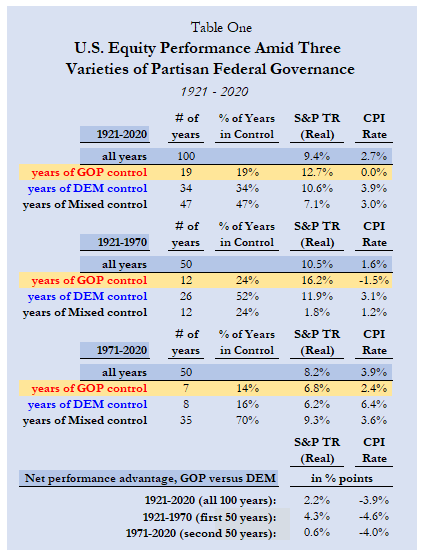
Table One provides the same summary evidence on equities but partitions the past century into two fifty-year periods (1921-1970 and 1971-2020), while also reporting inflation data (the CPI rate). In both sub-periods full control by the GOP has been better for equities and inflation than has full control by Democrats. In the latter case, relatively much higher inflation (3.9% p.a.) has eroded real equity returns. The best period for equities (+16.2% p.a. for a dozen years during 1921-1970) has occurred with deflation, on average (-1.5% p.a.). So much for the claim that deflation is an impediment to solid gains in equities (or economic growth) – or that inflation is “bullish.”

It’s undeniable that GOP control has delivered a net performance advantage in equities (see the bottom three rows of Table One), with equity returns better by 2.2% points p.a. and inflation better by 3.9% points p.a. (for all 100 years) and equity returns better by 4.3% points p.a. and inflation better by 4.6% points p.a. for the first fifty years (1921-1970). The GOP advantage has lessened over the past fifty years: +0.6% points p.a. (for equities) and +4.0 % points p.a. (for CPI).
Conventional opinion today says U.S. equities perform better under divided government. That is true, but only for 1971-2020, not for 1921-1970. For the full century (1921-2020) equities have performed better when government has been unified (under either party) but better still when unified under Republicans. For 1921-2020 full control by Democrats—which will be the case for 2021-22 (at least)—delivered better equity performance (10.6% p.a.) compared to mixed control (7.1% p.a.), but that has not been true over the past fifty years (1971-2020), when full Democratic control yielded real equity returns of only +6.2% p.a. versus 9.3% p.a. under mixed control.
If history (especially more recent history) is a guide, U.S. equity gains over the next two years of full Democratic control will be inferior, a result that is more probable given that the party is currently more anti-business, anti-profit, and anti-capitalist than at any other time since 1970.


0 Comments